Home>Finance>Candlestick Chart Definition And Basics Explained
Finance
Candlestick Chart Definition And Basics Explained
Published: October 22, 2023
Learn the basics of candlestick charts in finance. Understand the definition and key concepts behind this powerful analytical tool.
(Many of the links in this article redirect to a specific reviewed product. Your purchase of these products through affiliate links helps to generate commission for LiveWell, at no extra cost. Learn more)
Candlestick Chart: Understanding the Basics
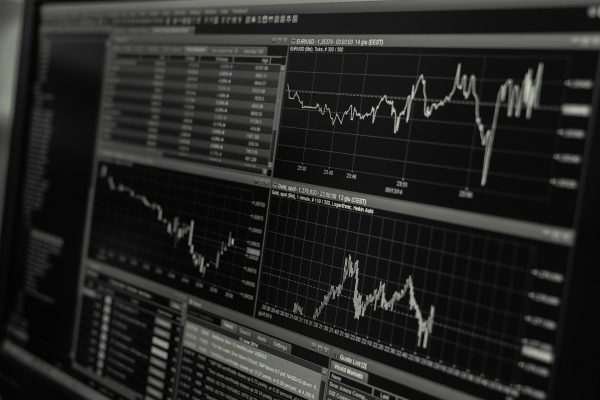
When it comes to analyzing financial markets, a candlestick chart is a widely used tool that provides a visual representation of price movements over a specific period. In this blog post, we will explore the definition and basics of candlestick charts, giving you a better understanding of how they work and how you can use them in your financial analysis.
Key Takeaways:
- Candlestick charts are a popular charting technique used in Technical Analysis.
- They visually represent price movements over a specific period of time, usually depicted as daily, weekly, or monthly.
So, what exactly is a candlestick chart? A candlestick chart consists of individual “candles” that represent the price movement of an asset within a specific time frame. Each candle is composed of four main components: the open, close, high, and low prices.
The body of the candle, typically rectangular in shape, represents the difference between the open and close prices. If the close price is higher than the open price, the body is usually filled or colored. Conversely, if the close price is lower than the open price, the body remains blank or is indicated by a different color. This color-coding is often used to differentiate between bullish (upward) and bearish (downward) price movements.
At the top and bottom of the body, you will find small lines called “wicks” or “shadows.” These wicks represent the high and low prices reached during the time frame. The upper wick extends from the top of the body to the highest price, while the lower wick extends from the bottom of the body to the lowest price.
Now that we understand the basic components of a candlestick chart, let’s dive into the significance of these patterns. Candlestick charts provide valuable insights into market sentiment and price trends. By analyzing the shapes, sizes, and patterns formed by these candles, traders and investors can make more informed decisions.
Two key takeaways to keep in mind when analyzing candlestick charts:
- Engulfing Patterns: A bullish engulfing pattern occurs when a small bearish candle is followed by a larger bullish candle. It indicates a potential reversal in price, with buyers taking control from sellers. On the other hand, a bearish engulfing pattern occurs when a small bullish candle is followed by a larger bearish candle, suggesting a reversal to the downside.
- Doji: A Doji candlestick has a small or no body, with the open and close prices being very close or almost identical. This pattern signifies indecision in the market and can indicate a potential trend reversal. Traders often consider the Doji candlestick as a signal to be cautious and look for confirmation from subsequent candlestick patterns.
By understanding these key patterns and observing them in conjunction with other technical indicators, traders can gain valuable insights into the future direction of a particular asset. However, it is important to note that candlestick patterns should not be considered in isolation and should always be used in combination with other analysis techniques, such as trendlines, support and resistance levels, and volume indicators.
In conclusion, candlestick charts provide a visual and insightful way to analyze price movements in financial markets. By understanding the basics of candlestick charting and recognizing key patterns, traders can enhance their decision-making process and increase the probability of successful trades. So next time you review charts, don’t forget to consider the power of candlestick patterns!
What's Hot
Latest Articles
Related Post

By: • Finance
By: • Finance
By: • Finance
By: • Finance

By: • Finance
By: • Finance

By: • Finance

By: • Finance


By: • Finance
By: Chelsea • Finance