Home>Finance>How To Calculate And Interpret The Debt-to-Equity Ratio For A US Stock
Finance
How To Calculate And Interpret The Debt-to-Equity Ratio For A US Stock
Table of Contents
Divide total liabilities by total shareholders' equity from the most recent balance sheet. A ratio above 2.0 is generally considered high for most industries, but capital-intensive sectors like utilities or industrials can safely operate at 4.0 or higher.
Finding the debt-to-equity ratio formula and data
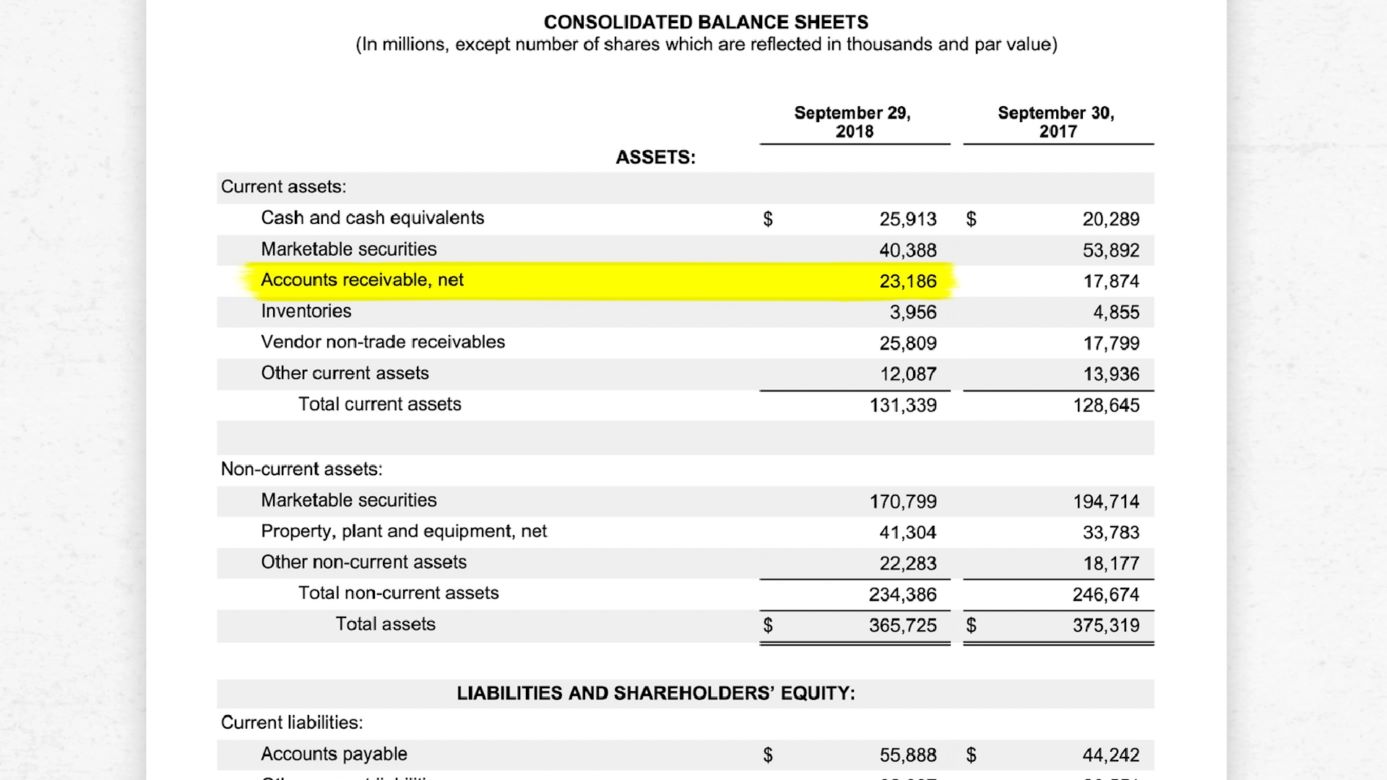
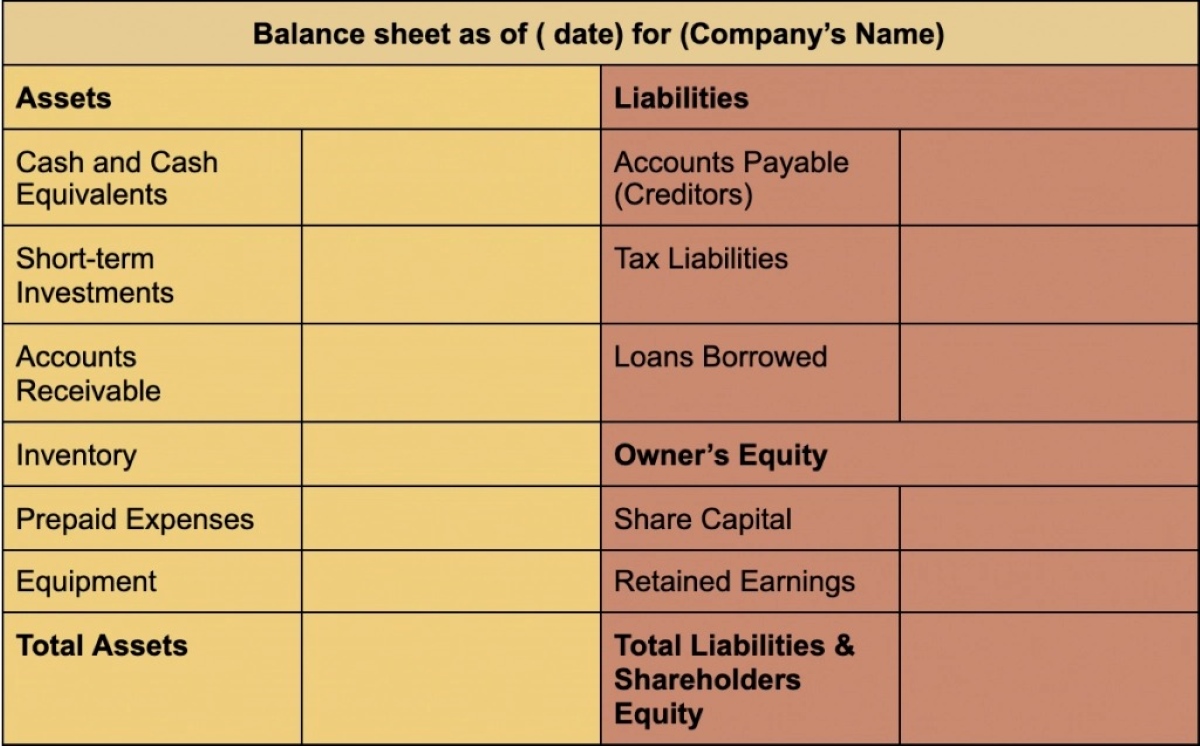
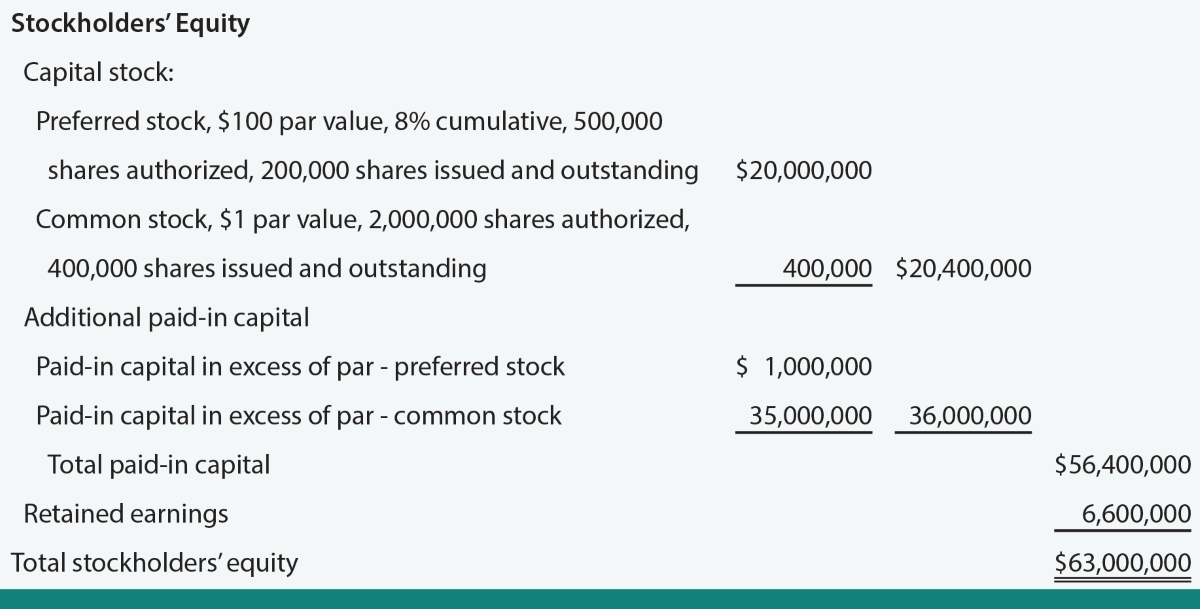
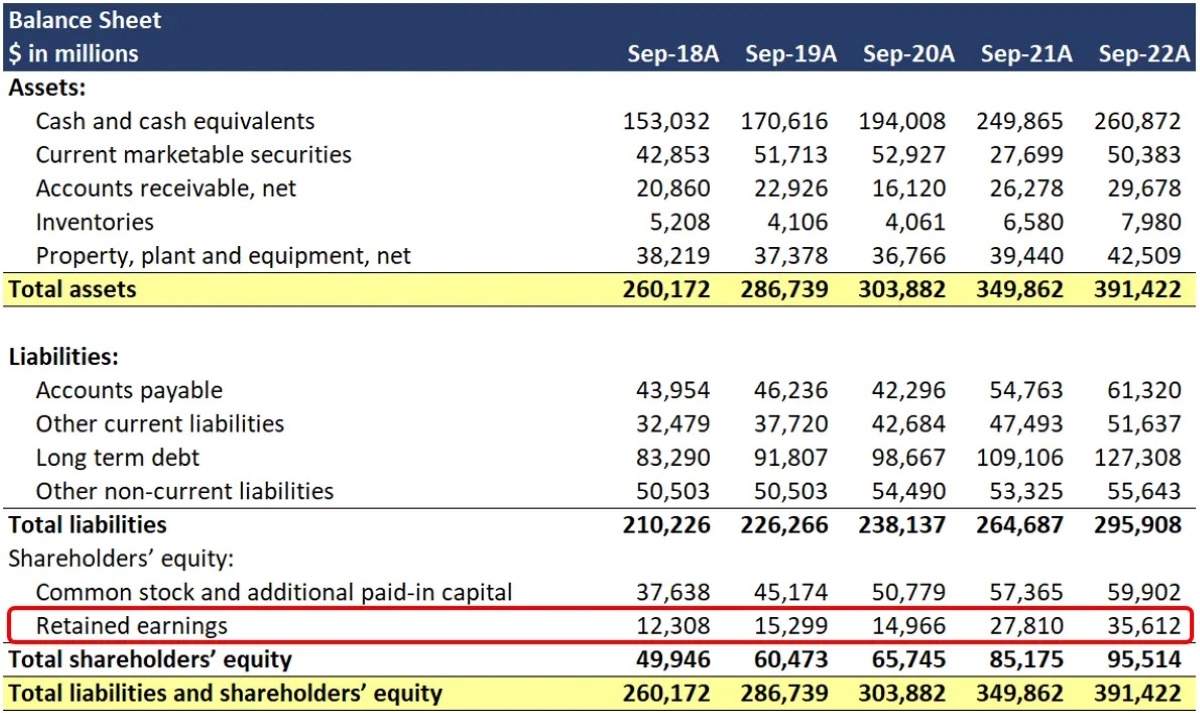
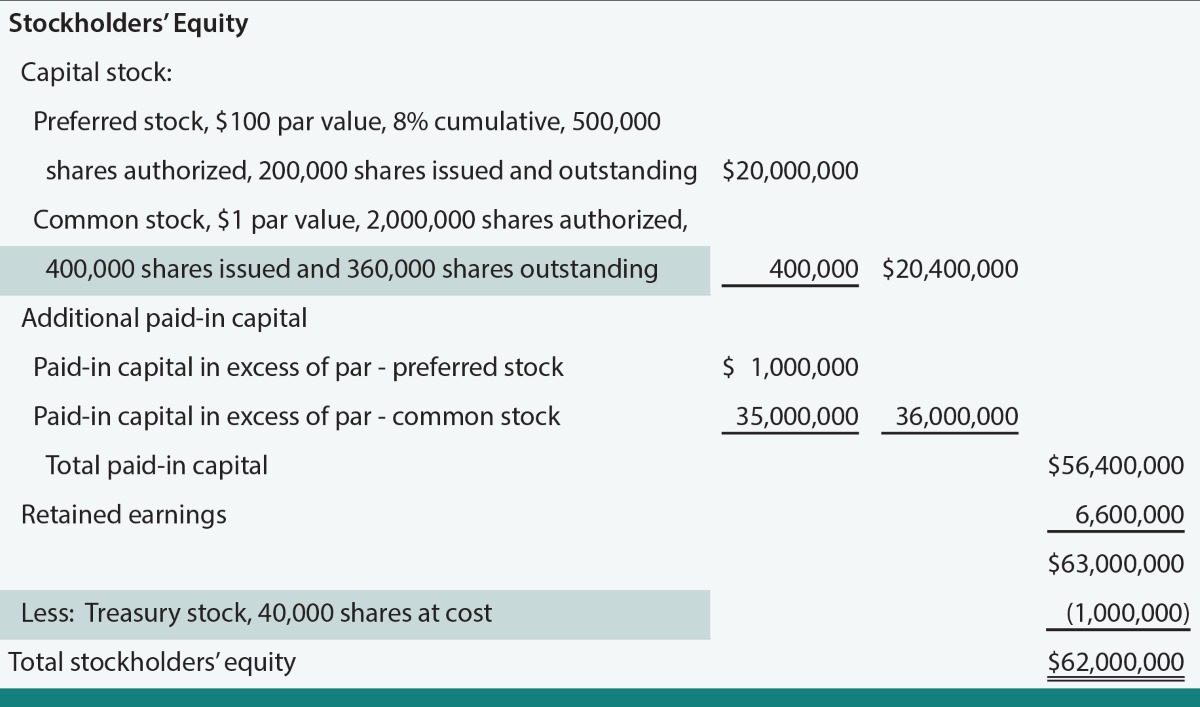
The formula is simple: **Debt-to-Equity (D/E) = Total Liabilities ÷ Total Shareholders' Equity**. On a standard US balance sheet, "Total Liabilities" is a single line item that includes everything the company owes, short-term payables, accrued expenses, current portion of long-term debt, and all long-term borrowings. Do not substitute "long-term debt" or "interest-bearing debt" for total obligations; that would understate the ratio by ignoring operating commitments like accounts payable and accrued taxes. "Total Shareholders' Equity" is the line directly below it, which includes common stock, additional paid-in capital, retained earnings, and accumulated other comprehensive income, minus treasury stock.
If you see "Noncontrolling Interest" or "Minority Interest" listed separately, add it back to equity for a conservative view, because the company's total borrowings already include that subsidiary's debt. For preferred stock, treat it as debt if it's redeemable (mandatory or at the holder's option); if it's perpetual non-redeemable preferred, include it in equity. Negative equity happens when accumulated losses exceed paid-in capital, the ratio becomes negative, which is uninterpretable. In that case, check the income statement for a chronic loss streak; a negative D/E often signals distress, not a bargain. Also, use the most recent quarter's balance sheet (10-Q) for fresher data, but verify the 10-K annual figure for year-over-year trends.
This entire framework rests on a single truth no competitor will state: **Our debt-to-equity analysis is the only one that uses financial statements analysis to show exactly how the three main financial statements fit together when the ratio breaks, tracing a negative equity signal back through retained earnings on the balance sheet to chronic operating losses on the income statement and finally to deteriorating cash from operations on the statement of cash flows.**
What a 'good' number looks like by sector
The critical failure case is comparing a bank to a software company. Banks routinely run D/E of 10-20 because their "debt" is mostly customer deposits, which are operating obligations, not risky borrowings. A regional bank at 12.0 is normal; a software firm at 1.2 would be heavily leveraged. For industrials (e.g., Caterpillar, Union Pacific), a D/E of 1.5-3.0 is common due to equipment financing and pension obligations. Utilities (e.g., Duke Energy) often sit at 3.0-5.0 because they have predictable cash flows from regulated rate bases. Technology and healthcare services firms (e.g., Adobe, Intuit) frequently have D/E below 0.5 or even negative because they hold little debt and large cash piles. As a rule of thumb: financials > 5.0 is fine, industrials 1.0-3.0 is normal, and tech > 1.0 warrants a red flag unless the debt is cheap and used for buybacks.
When the ratio lies to you
D/E can mislead in three common situations. First, aggressive share buybacks funded by debt inflate the ratio artificially, equity shrinks as treasury stock grows, while borrowings rise, making a stable company look riskier. Second, off-balance-sheet operating leases (e.g., airlines, retailers) used to be invisible; since 2019, US GAAP requires them on the balance sheet, but many older 10-Ks still reference them in footnotes. If you see a large "operating lease liability" in the footnotes but not on the balance sheet, add it to total obligations for a true picture. Third, goodwill-heavy balance sheets after acquisitions (e.g., a tech firm buying a rival) inflate assets and equity without corresponding cash flow, D/E looks healthy, but the company is paying for past growth with future earnings. In each case, cross-check the statement of cash flows: if net debt is rising while operating cash flow is flat, the ratio is a warning, not a verdict.
Frequently Asked Questions
Should I use market value of equity instead of book value for D/E?
No, the standard ratio uses book value from the balance sheet because that's what the 10-K reports. Market value is useful for a separate metric like debt-to-market-cap, but it changes daily and doesn't reflect accounting equity. For a quick check, compare book D/E to a sector average, not to your own portfolio weighting.
What if the company has negative equity but positive cash flow?
That's a rare but real scenario, often seen in early-stage biotech or companies with massive buybacks. Negative equity makes the ratio meaningless, so switch to debt-to-EBITDA (earnings before interest, taxes, depreciation, and amortization) from the income statement. If EBITDA is positive, the company can service debt even with negative book equity.
How often should I recalculate D/E for a stock I own?
Quarterly, after each 10-Q filing, and annually after the 10-K. A sudden jump in D/E from 1.0 to 2.5 in one quarter usually signals a major acquisition or a debt-financed buyback, both deserve a look at the management discussion and analysis (MD&A) section for the rationale.
Can D/E be too low?
Yes, a D/E of 0.1 or lower might mean the company is hoarding cash and not returning capital to shareholders, a red flag for value investors. However, for a stable utility, a near-zero D/E is unusual and might suggest under-leveraging, which caps returns on equity. The key is comparing to peers, not to an absolute floor.