Home>Finance>How To Spot Revenue Recognition Red Flags Before A Stock Drops
Finance
How To Spot Revenue Recognition Red Flags Before A Stock Drops
Table of Contents
Watch for cash flow from operations consistently lagging net income, a sudden spike in unbilled receivables, and management changing revenue recognition policies to accelerate bookings without a legitimate business reason. These gaps almost always precede a correction when the underlying economics can't support the reported growth.
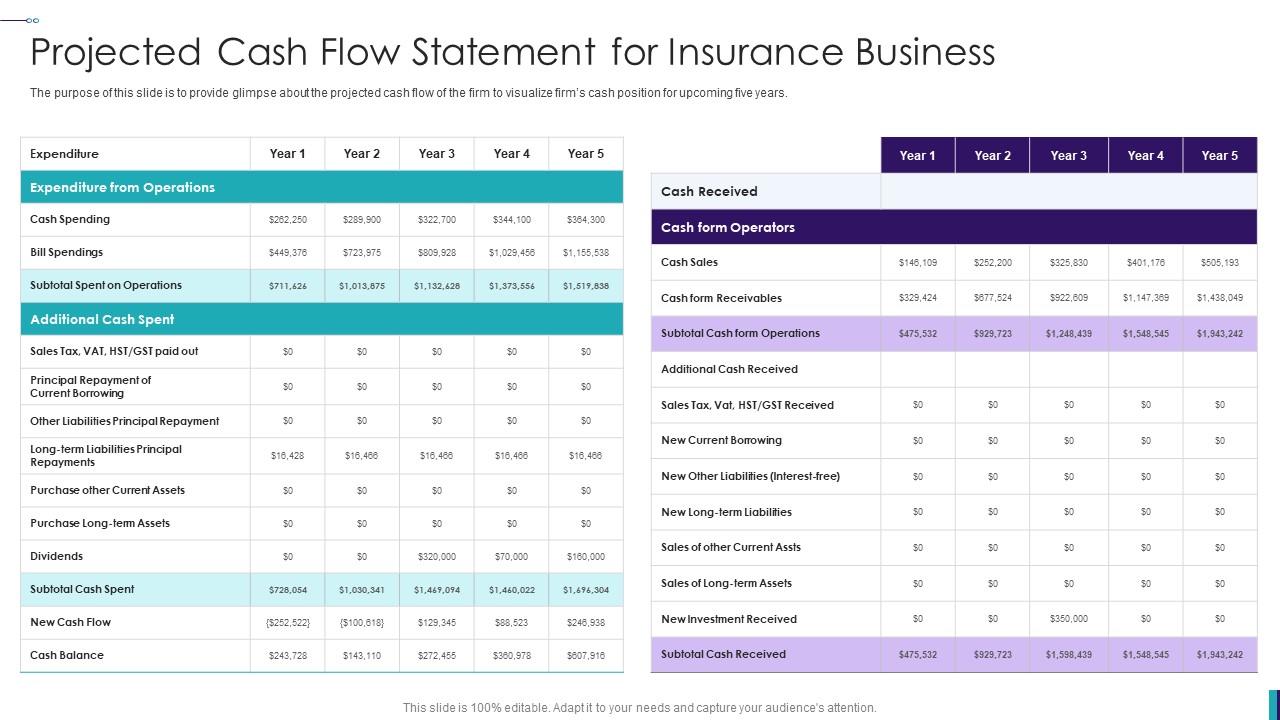
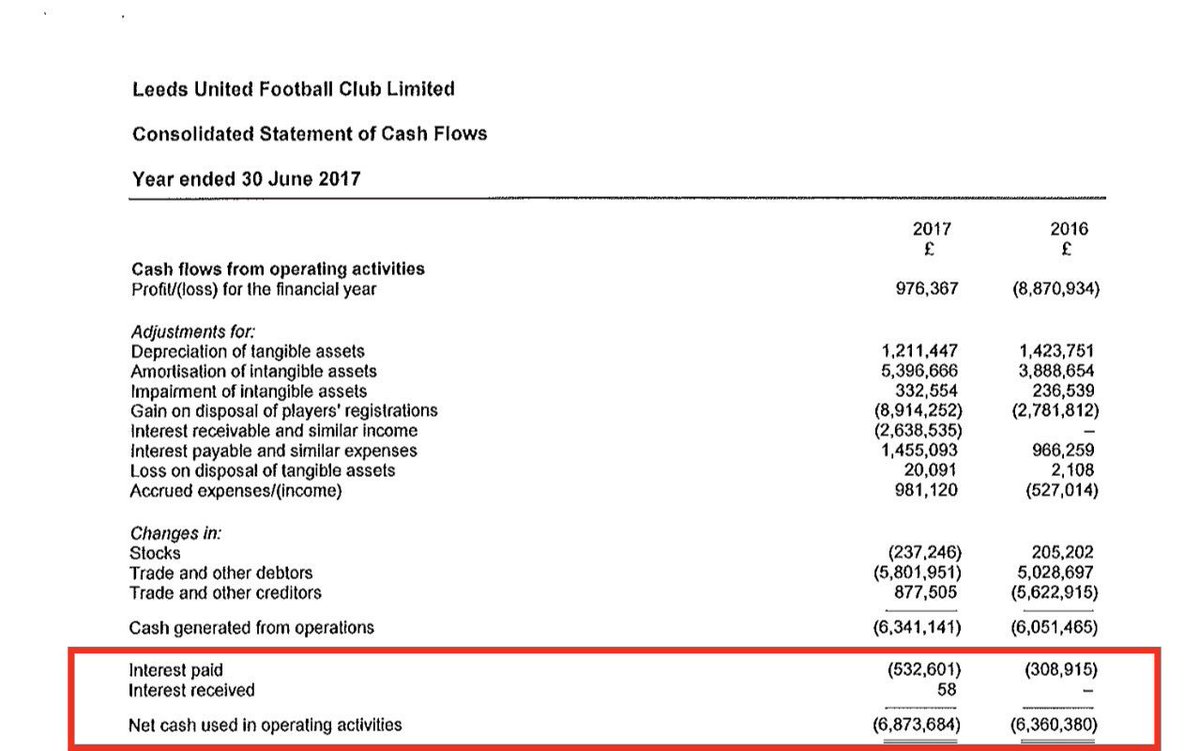
The revenue recognition red flags in cash flow
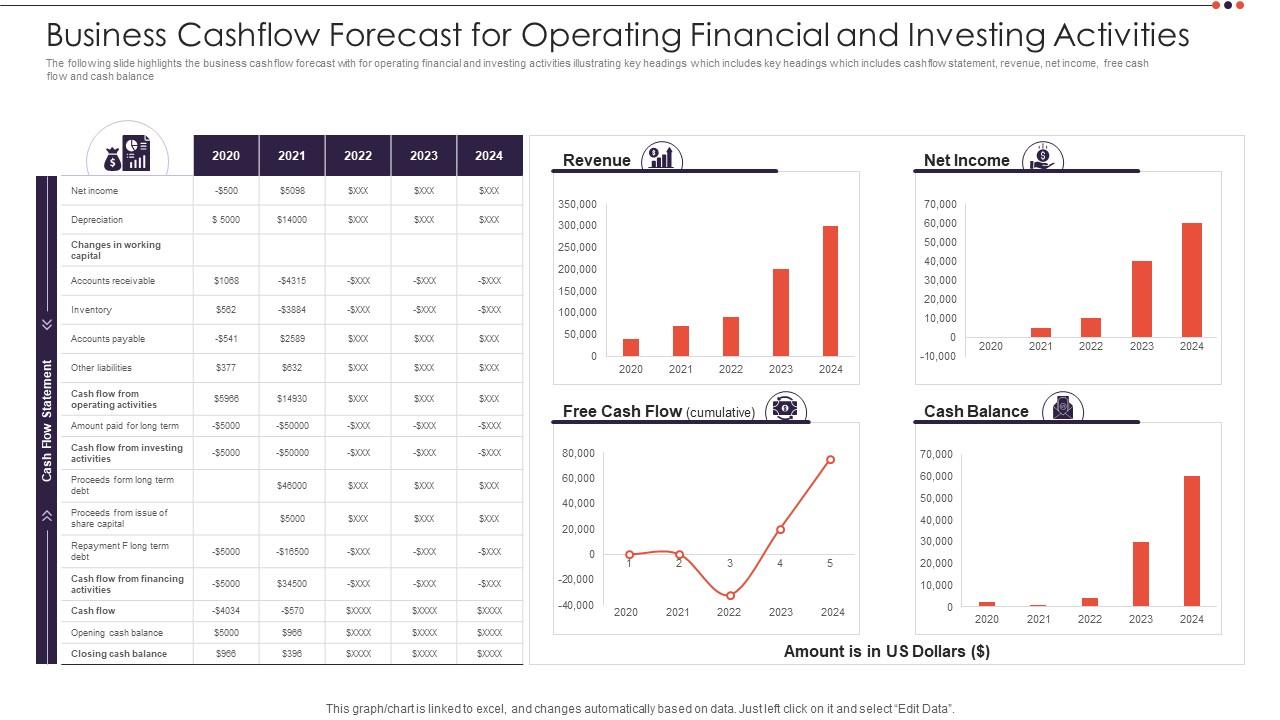
Pull up the cash flow report for the last eight periods alongside the income statement. Calculate operating cash flow (OCF) minus net income for each period, then look at the trend. A healthy business shows OCF roughly equal to or slightly above net income over time, that's the baseline. When OCF consistently lags net income by 15% or more for three straight periods, you're seeing revenue that exists on paper but never hits the bank account. The classic setup: sales grow 20% year-over-year, but accounts receivable grow 40%, and OCF is flat or shrinking. That divergence means the firm is booking revenue faster than it's collecting cash, which is only sustainable if the business is in hyper-growth mode, and even then, it breaks eventually. Check the ratio of OCF to net income; below 0.8 for four consecutive periods is a red flag that demands a reason. The reason might be legitimate, but if you can't find one in the MD&A section, you've found your exit signal.
When unbilled receivables hide the truth
Open the balance sheet and look for "unbilled receivables," "contract assets," or "accrued revenue" under current assets. These line items represent work you've completed, revenue you've recognized, but invoices you haven't sent yet, usually because the customer hasn't been billed per the contract terms. A small, stable number here is normal for project-based businesses. What kills investors is when this line grows at twice the rate of revenue for multiple periods. Say revenue grows 15% but these accrued amounts grow 60%, that tells you the firm is recognizing revenue faster than the contract milestones justify. Dig into the footnotes on revenue recognition to see the specific policy. If management is using the "percentage of completion" method but the disclosed costs incurred don't match the revenue recognized, you've caught the manipulation. Also check "deferred revenue" on the liability side: if that's falling while unbilled balances rise, the enterprise is borrowing from future periods to flatter today's numbers. That's the exact pattern that preceded the collapses of several now-delisted software and construction firms.
The policy change nobody talks about
Scroll to the critical accounting policies section in the 10-K and compare the revenue recognition language year-over-year. Management loves to bury changes in the footnotes, so look for phrases like "we now recognize revenue when" or "beginning in fiscal year, we updated our estimate for." A common move is switching from recognizing revenue at point-of-delivery to over time, which pulls years of future revenue into the current period. Another is changing the "expected credit loss" estimate on outstanding invoices to reduce the allowance for doubtful accounts, which inflates net income without any operational improvement. The most dangerous version is reclassifying one-time gains, like selling an asset or a legal settlement, into recurring revenue line items. If you see a one-time boost in Q3 that wasn't there in Q2, and the footnotes don't explain it as a genuine contract win, treat it as a warning. The market usually prices this in within two periods because the next year's numbers can't repeat the trick, and the stock drops when the comparison gets tough.
When the answer is no
Not every cash flow gap or receivable spike is fraud. A business transitioning from one-time licenses to multi-year subscriptions will show OCF lagging net income for 4-6 periods because you're collecting cash upfront but deferring the revenue, that's actually a good sign. Similarly, a construction firm with a $500M contract that runs 3 years will naturally have unbilled balances grow in the early phases when it recognizes revenue on costs incurred but hasn't hit billing milestones yet. The key is comparing against the organization's own history and industry peers. If the OCF/net income ratio has been above 0.9 for years and dips to 0.7 while the entity is signing new large contracts, that's normal. If the ratio has been deteriorating for 6 periods with no new contract announcements, that's the opposite. Always check the cash flow from investing activities too, if capital expenditures are rising in line with the receivable growth, the entity is investing in growth, not cooking books. Use a simple screen: compare the 3-year average OCF margin to the current period. A healthy enterprise hovers within 2-3 percentage points; anything wider warrants a thorough examination of the footnotes. This is where your existing skills in financial statements analysis pay off, you're not just looking at one number, you're triangulating across the balance sheet, income statement, and cash flow report to see if the story holds together.
Frequently asked questions
How many periods of cash flow lag should I tolerate before selling?
One period is noise, two is a trend, three is a problem. If you're at three consecutive periods of OCF below 80% of net income, and you can't identify a specific contract win or business transition in the MD&A, the risk of a correction is too high to hold through earnings season.
What's the fastest way to check if unbilled balances are abnormal?
Calculate the accrued revenue line as a percentage of trailing twelve-month revenue, then compare that ratio to the same period last year. If it's up more than 50% year-over-year while revenue grew less than 20%, you've found a red flag. The footnotes will tell you if there's a legitimate reason, but you have to look.
Can I use free cash flow instead of operating cash flow for this analysis?
Yes, but only if you adjust for working capital changes. Free cash flow subtracts capital expenditures, which can obscure a collection problem if the firm is also cutting capex. Stick with OCF minus net income for the cleanest comparison, then check FCF to confirm the trend.
Where can I see a cash flow statement and why does it matter more than profit?
It's in the 10-K, right after the income statement and balance sheet. It matters because profit is an opinion, it's subject to estimates and judgments, but cash is a fact. The cash flow report shows you whether the revenue you read on the income statement actually turned into money the enterprise can spend, reinvest, or return to shareholders.
How do the three main financial statements fit together when spotting fraud?
The income statement shows revenue and profit, the balance sheet shows the outstanding invoices and contract assets where that profit lives, and the cash flow report shows whether that profit ever became cash. When you see revenue growth on the income statement, you must check the balance sheet for swelling customer obligations and the cash flow report for a shrinking OCF. All three have to agree; when they don't, you've found the manipulation.
You already know how to read an income statement for a company i might invest in, so this isn't about basics, it's about catching the specific fingerprints of manipulation before the market does. The trick is learning to separate the noise of normal business cycles from the signal of engineered top-line numbers, and that starts with three specific checks you can run in under an hour.