
Finance
What Does Last Mean In Stocks
Published: January 18, 2024
Learn the meaning of "last" in the stock market and how it impacts your financial decisions. Gain insights into finance with this informative guide.
(Many of the links in this article redirect to a specific reviewed product. Your purchase of these products through affiliate links helps to generate commission for LiveWell, at no extra cost. Learn more)
Table of Contents
Introduction
Welcome to the world of stock trading! If you are new to the game, you might come across various jargon and terms that can be confusing at first. One such term is “last.” In the context of stocks, the “last” price refers to the most recent transaction price at which a particular stock was traded. This information is vital for both traders and investors as it helps them gauge the current value of a stock.
Understanding the concept of “last” in stock trading is crucial for making informed investment decisions. Whether you are actively trading stocks or considering long-term investments, knowing the significance of the last price can greatly impact your strategy. In this article, we will delve deeper into the concept of the “last” price and its relevance in stock trading.
But why is the “last” price so important? Well, it serves as a key indicator of market activity, reflecting the most recent buying and selling sentiment around a particular stock. By keeping an eye on the last price, investors can identify trends, identify potential opportunities, and make timely decisions based on price movements.
However, it’s important to note that the “last” price is just one piece of the puzzle when it comes to stock analysis. To fully grasp the implications of the last price, one must also consider other factors that influence the stock’s performance, such as trading volume, market trends, company fundamentals, and economic indicators.
Throughout this article, we will explore the factors that affect the last price, how to interpret it in stock trading, and the limitations of relying solely on this metric. Additionally, we will discuss other key metrics to consider when analyzing stocks. By the end of the article, you will have a comprehensive understanding of the “last” price and its significance in the world of stock trading.
Understanding the Concept of “Last” in Stocks
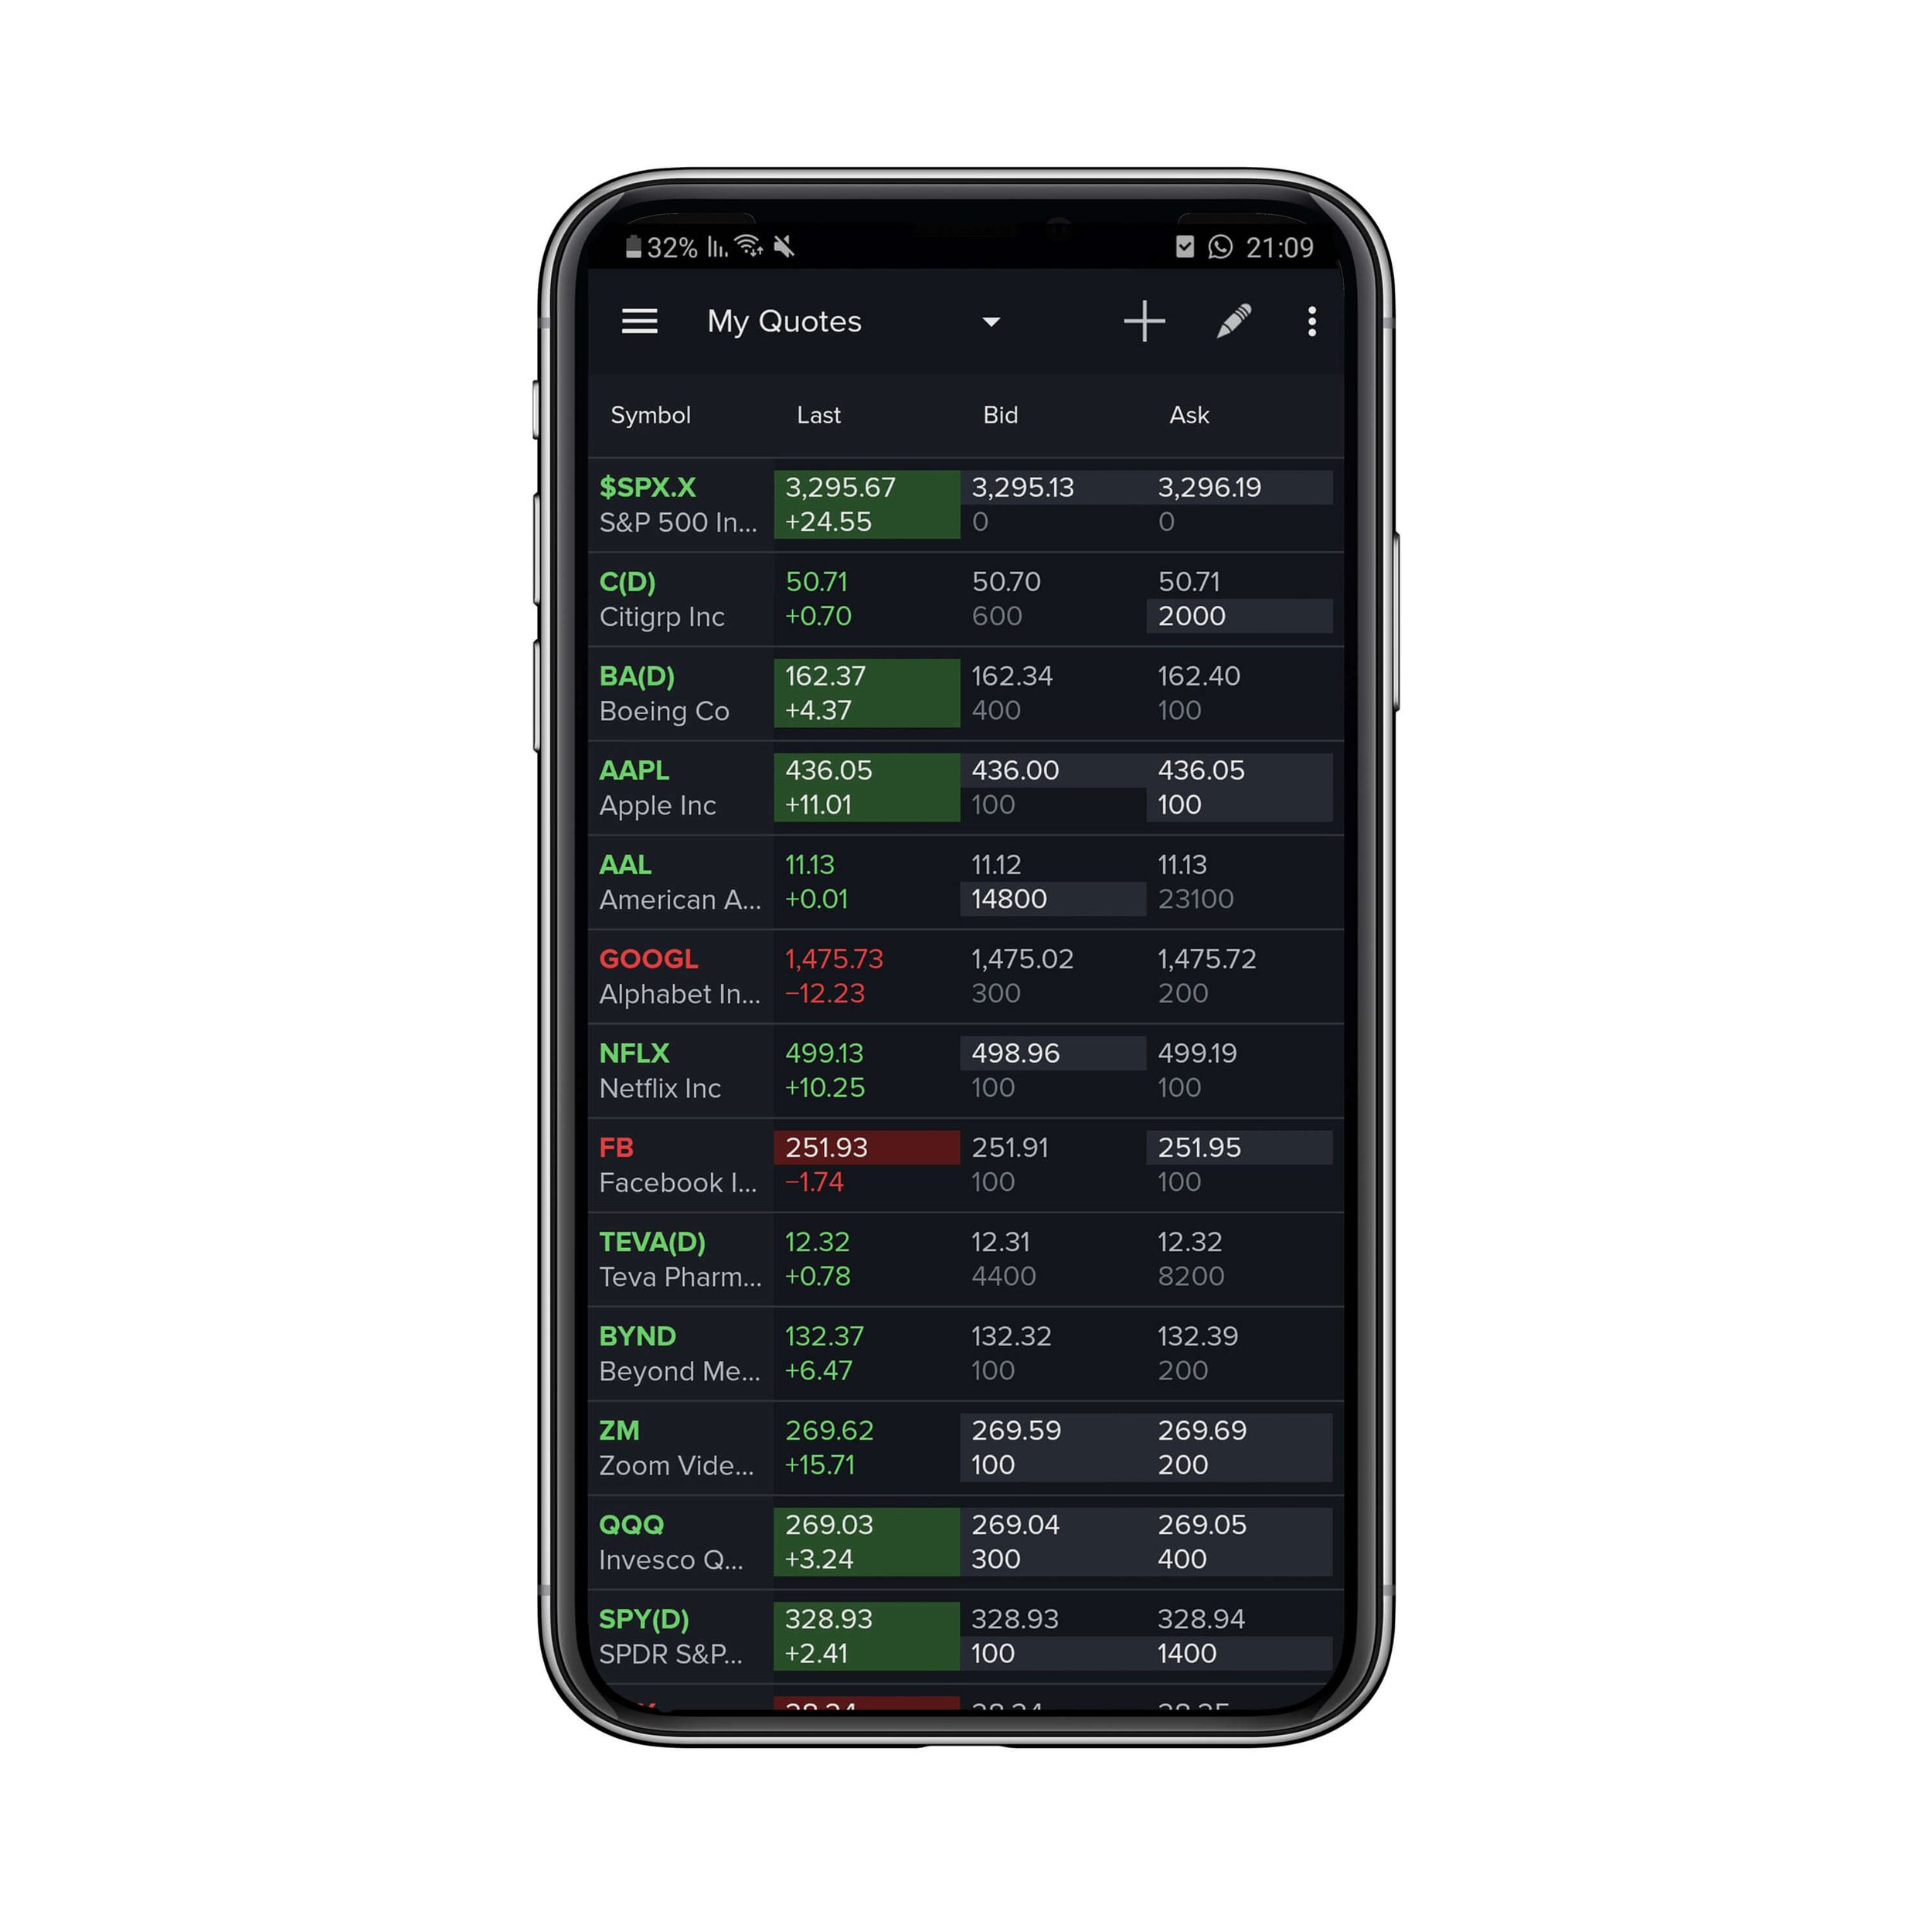
When we talk about the “last” price in stocks, we are referring to the most recent transaction price at which a particular stock was traded. It represents the price at which the most recent buyer and seller agreed upon for a specific stock.
Typically, the last price is displayed in real-time on stock market websites, trading platforms, and financial news platforms. It provides investors and traders with up-to-date information on the current value of a stock and is a crucial piece of data used in technical analysis.
One of the important things to understand about the last price is that it is not necessarily an indication of a stock’s overall value. Instead, it reflects the most recent buying or selling activity surrounding a stock. This means that the last price can change frequently throughout a trading session as new transactions take place.
It’s also important to note that the last price may not always accurately reflect the current market sentiment or the perceived value of a stock. This is because the last price is determined by the most recent trade, which could be influenced by various factors such as market orders, limit orders, and the availability of buyers and sellers.
For example, if a stock has a low trading volume and only a few transactions have taken place, the last price may not accurately reflect the true value of the stock. In contrast, a highly liquid stock with a large number of transactions will generally have a more reliable and accurate last price.
The last price is especially relevant for day traders and short-term investors who seek to capitalize on short-term price movements. These market participants closely monitor the last price to identify potential buying or selling opportunities. By analyzing the last price along with other important metrics such as volume and price patterns, traders can make more informed decisions and take advantage of short-term price fluctuations.
Importance of the “Last” Price
The “last” price of a stock holds significant importance for both traders and investors. Here are a few key reasons why the last price is crucial in stock trading:
1. Real-Time Value: The last price provides investors with real-time information about the current value of a stock. It allows them to assess the immediate market sentiment and make timely decisions based on the most recent trading activity.
2. Market Activity Indicator: The last price serves as a key indicator of market activity. By monitoring the last price, traders can gauge the level of buying or selling pressure surrounding a particular stock. This information can be valuable in identifying shifts in market sentiment and potential trading opportunities.
3. Order Execution: For those actively trading stocks, the last price is crucial for executing buy or sell orders. Traders can use the last price to determine at what price other market participants are currently buying or selling a stock. This helps them determine the most appropriate price at which to enter or exit a trade.
4. Short-Term Price Movements: Day traders and short-term investors closely track the last price to identify short-term price movements. By analyzing the last price along with other technical indicators, such as support and resistance levels, they can anticipate potential price swings and capitalize on them for short-term profits.
5. Stop Losses and Take Profits: The last price is critical in setting stop loss and take profit levels. Traders often use these orders to automatically close their positions if the market reaches a specific price target or experiences a certain level of adverse movement. By basing their stop loss and take profit levels on the last price, traders can more effectively manage their risk and protect their gains.
6. Price Trends and Patterns: By analyzing the historical last price data, traders can identify price trends and patterns. This information can help them make more informed decisions and predict potential future price movements. Traders often use technical analysis tools, such as moving averages and trendlines, in combination with the last price to identify these trends and patterns.
Overall, the “last” price plays a crucial role in stock trading by providing real-time information about a stock’s value, indicating market activity, assisting in order execution, aiding in short-term trading strategies, facilitating risk management, and helping identify price trends and patterns. However, it’s important to remember that the last price is just one piece of the puzzle, and it should be considered alongside other key metrics and factors when making investment decisions.
Factors Affecting the Last Price
The last price of a stock is influenced by various factors that drive buying and selling activity in the market. Understanding these factors can provide valuable insights into the dynamics of price movement. Here are some key factors that can affect the last price:
1. Supply and Demand: The basic principle of supply and demand plays a crucial role in determining the last price. If there is more buying interest than selling interest for a particular stock, the price is likely to increase. Conversely, if there is more selling pressure than buying interest, the price is likely to decrease. The imbalance between supply and demand dictates the direction in which the last price moves.
2. Company Performance: The fundamental performance of a company can significantly impact its stock price. Positive earnings growth, strong financials, and favorable news about the company can attract buyers and lead to an increase in the last price. On the other hand, negative earnings reports, declining revenue, or negative news can drive selling pressure and result in a decrease in the last price.
3. Economic Factors: Economic factors, such as interest rates, inflation, GDP growth, and geopolitical events, can influence the last price. For example, if the economy is experiencing low interest rates and favorable economic conditions, investors may be more optimistic about the prospects of companies and are willing to pay higher prices, leading to an increase in the last price.
4. Industry and Sector Trends: Market trends and sentiments within specific industries and sectors can impact the last price of stocks within those sectors. Positive industry trends, such as technological advancements or increasing consumer demand, can lead to increased investor interest and higher last prices for stocks in those industries. Conversely, negative industry or sector-specific events can lead to a decrease in the last price.
5. Market Sentiment: Investor sentiment plays a significant role in the last price movement. Favorable news, positive market expectations, and general optimism can drive buying activity and push up the last price. Conversely, negative sentiment, economic uncertainty, or market volatility can result in selling pressure, leading to a decrease in the last price.
6. Market Order Fluctuations: The last price can be influenced by the type of market orders placed by buyers and sellers. Market orders are executed at the prevailing market price, which can cause fluctuations in the last price. Large buy or sell orders can significantly impact the last price as they create imbalances between supply and demand.
It’s important to note that these factors are interrelated and can influence each other. For example, negative news about a company’s performance can lead to decreased investor sentiment, which in turn can result in a decrease in the last price. Traders and investors should consider these factors and continuously assess market conditions when analyzing the last price and making investment decisions.
Interpreting the Last Price in Stock Trading
Interpreting the last price of a stock is an important aspect of successful stock trading. By analyzing the last price along with other information, traders can gain insights into the market sentiment and make informed trading decisions. Here are some key aspects to consider when interpreting the last price:
1. Trend Analysis: By comparing the current last price to historical data, traders can identify trends in a stock’s price movement. Rising last prices over time indicate an uptrend, while falling last prices suggest a downtrend. Trend analysis can help traders determine the overall direction of a stock’s price and make decisions accordingly.
2. Support and Resistance: Support and resistance levels are price levels at which a stock has historically had difficulty moving below (support) or above (resistance). When the last price approaches these levels, it can provide important signals to traders. Breaking through a resistance level may indicate a potential upward trend, while a drop below a support level may suggest a potential downward trend.
3. Volume: The trading volume, which represents the number of shares traded, can provide additional insights alongside the last price. High volume accompanying an increase in the last price suggests strong buying interest and potentially indicates a bullish trend. Conversely, high volume accompanying a decrease in the last price may indicate increased selling pressure and a potential bearish trend.
4. Price Patterns: The last price can form various price patterns, such as triangles, double tops, or head and shoulders patterns. These patterns can provide valuable information about potential trend reversals or continuation. Traders use technical analysis techniques in combination with the last price to identify these patterns and make trading decisions.
5. Relative Strength: By comparing a stock’s last price to the performance of its benchmark index or sector, traders can determine its relative strength. If a stock’s last price outperforms its benchmark, it may indicate a strong stock with positive market sentiment. On the other hand, if a stock’s last price lags behind its benchmark, it may suggest a weaker stock with potentially negative market sentiment.
6. News and Events: Monitoring news and events related to a stock is crucial when interpreting the last price. Positive news, such as earnings reports or product launches, can drive up the last price, while negative news, like regulatory issues or poor financial performance, can lead to a decrease. Traders should stay updated on such events to understand the context behind the last price movement.
Remember, interpreting the last price is just one aspect of comprehensive stock analysis. It is essential to consider other factors like company fundamentals, market trends, and broader economic conditions when making trading decisions. By combining these insights with the last price, traders can develop a well-rounded understanding of a stock’s potential and make more informed trading decisions.
Examples of Last Price Movements
To understand the significance of last price movements in stock trading, let’s explore a few examples of how different scenarios can impact the last price:
1. Bullish Trend: In a bullish trend, the last price consistently increases over time. For example, let’s say a technology company releases a groundbreaking product that exceeds market expectations. Positive news and strong demand for the product attract investors, leading to increased buying activity. As a result, the last price of the stock steadily rises, reflecting the positive sentiment and the upward trend.
2. Bearish Trend: Conversely, a bearish trend is characterized by falling last prices over time. Suppose a company faces a series of setbacks, such as declining sales, management issues, or negative industry news. These factors erode investor confidence, leading to increased selling pressure. The last price of the stock starts to decline as selling activity outweighs buying activity, indicating a bearish trend.
3. Volatile Price Swings: Price volatility can also cause significant last price movements. For instance, a biotech company awaits regulatory approval for a breakthrough drug. Speculation and uncertainty surround the outcome of the approval process. As information and rumors circulate, the last price experiences notable fluctuations. Positive news or rumors may cause the last price to surge, while negative news can result in a sharp decline.
4. Breakout or Breakdown: Breakouts and breakdowns occur when a stock price moves beyond a well-defined support or resistance level. For example, let’s suppose a company’s stock has been trading within a narrow range with a strong resistance level at $50. If the last price breaks above this resistance and continues to rise, it indicates a bullish breakout. Conversely, if the last price falls below a support level at $40 and continues to decline, it suggests a bearish breakdown.
5. Reversal Patterns: Reversal patterns are chart patterns that indicate a potential change in trend. For instance, a stock that has been experiencing a downtrend for some time may exhibit a “double bottom” pattern. This pattern occurs when the last price reaches a low point, bounces back, experiences another decline, and then reverses upward. The second low represents a support level, and a subsequent rise in the last price may suggest a reversal and a potential shift to an uptrend.
These examples illustrate how different factors can influence last price movements, including market sentiment, company-specific news, technical patterns, and overall market conditions. It is important for traders to analyze these movements in conjunction with other indicators and factors to make informed trading decisions.
Limitations of Relying Solely on the Last Price
While the last price provides valuable information about a stock’s recent trading activity, relying solely on it has its limitations. Here are some key limitations to consider:
1. Lack of Context: The last price on its own does not provide context or a comprehensive view of a stock’s performance. It does not take into account the underlying factors driving the price movement, such as company fundamentals, market trends, or economic conditions. To gain a deeper understanding, one must consider other metrics and factors alongside the last price.
2. Market Volatility: In volatile markets, the last price can fluctuate rapidly as buying and selling activity becomes more intense. This volatility can make it challenging to accurately determine the fair value of a stock based solely on the last price. Traders need to consider the overall market conditions, trading volume, and broader trends to make informed decisions.
3. Bid-Ask Spread: The last price is based on the most recent trade executed, which can differ from the current bid and ask prices. The bid price represents the highest price a buyer is willing to pay, while the ask price represents the lowest price a seller is willing to accept. The difference between the bid and ask prices is known as the bid-ask spread. Depending on market conditions and liquidity, the bid-ask spread can be substantial, impacting the accuracy of the last price as an indicator of a stock’s value.
4. Delayed Reporting: In some cases, the last price reported may be delayed by a few seconds or minutes, making it less useful for traders who require real-time information. Traders who rely on immediate price changes may need to access more up-to-date data through direct market feeds from exchanges or trading platforms.
5. Lack of Fundamental Analysis: The last price focuses solely on the technical aspect of a stock’s trading activity, ignoring the fundamental analysis of the company. Factors such as earnings reports, financial statements, and industry trends can significantly impact a stock’s value. Relying solely on the last price neglects the broader picture of a company’s health and may lead to incomplete analysis.
6. Market Manipulation: While rare, market manipulation can impact the last price. Unscrupulous traders or entities may engage in practices like “pump and dump,” artificially inflating a stock’s price and then selling off their shares at a higher price. Traders should be cautious when relying solely on the last price during periods of market volatility or when dealing with low-volume stocks.
To overcome these limitations, traders should incorporate a variety of tools and techniques into their analysis, such as fundamental analysis, technical indicators, and market sentiment analysis. By considering multiple factors alongside the last price, traders can develop a more comprehensive understanding of a stock’s potential and make well-informed trading decisions.
Other Key Metrics to Consider in Stock Analysis
While the last price provides valuable information, it is essential to consider other key metrics when conducting a comprehensive stock analysis. These metrics provide additional insights into a company’s financial health, market position, and growth potential. Here are some important metrics to consider alongside the last price:
1. Earnings per Share (EPS): EPS represents a company’s profitability and is calculated by dividing its net earnings by the outstanding shares. It provides insights into a company’s ability to generate profits and is a key metric for evaluating its financial performance. Comparing a company’s EPS to industry peers and historical data can help assess its growth potential.
2. Price-to-Earnings (P/E) Ratio: The P/E ratio compares a company’s stock price to its earnings per share. It is a commonly used valuation metric that helps determine if a stock is overvalued or undervalued relative to its earnings. A higher P/E ratio suggests that investors are willing to pay a premium for future growth, while a lower P/E ratio may indicate a potential undervalued opportunity.
3. Dividend Yield: The dividend yield indicates the annual dividend payout of a stock relative to its price. It is expressed as a percentage and provides insights for income-oriented investors. A higher dividend yield may be attractive for those seeking regular income, while a lower yield might suggest a company reinvesting earnings for growth.
4. Market Capitalization: Market capitalization represents the total value of a company’s outstanding shares. It is calculated by multiplying the stock price by the number of shares. Companies are typically categorized as large-cap, mid-cap, or small-cap based on their market capitalization. Market capitalization helps assess a company’s size and is an important consideration for risk and growth potential.
5. Debt-to-Equity Ratio: The debt-to-equity ratio measures a company’s financial leverage by comparing its total debt to shareholders’ equity. It demonstrates the proportion of debt used to finance a company’s operations. A high debt-to-equity ratio may indicate higher financial risk, while a low ratio suggests a healthier balance sheet.
6. Return on Equity (ROE): ROE measures a company’s profitability by calculating its net income as a percentage of shareholders’ equity. It reflects how effectively a company utilizes shareholder investments to generate profits. A higher ROE indicates more efficient utilization of equity and potential shareholder value creation.
7. Cash Flow: Analyzing a company’s cash flow provides insights into its ability to generate and manage cash. Operating cash flow, investing cash flow, and financing cash flow help assess the company’s operational efficiency, capital allocation, and financial stability. Positive and consistent cash flow indicates a healthy business.
These key metrics, when combined with the last price, provide a more comprehensive understanding of a company’s financial performance, valuation, and growth potential. Traders and investors should consider these metrics alongside market conditions, industry trends, and other relevant factors to make informed decisions.
Conclusion
The “last” price plays a crucial role in stock trading, serving as an indicator of the most recent transaction price at which a stock was traded. It offers real-time information on a stock’s value and reflects the buying and selling sentiment surrounding it. However, it is important to recognize the limitations of relying solely on the last price in stock analysis.
By understanding the concept of the last price, traders and investors can interpret its significance in relation to trends, support and resistance levels, volume, and price patterns. However, it is equally important to consider other key metrics such as earnings per share, price-to-earnings ratio, dividend yield, market capitalization, and debt-to-equity ratio. These metrics provide a broader view of a company’s financial health, valuation, and growth potential.
While the last price is a valuable tool, it should not be used in isolation. By incorporating multiple indicators and factors into stock analysis, traders and investors can make more informed decisions and mitigate risks. Understanding market conditions, industry trends, news events, and broader economic factors is crucial in achieving a comprehensive understanding of a stock’s potential.
In conclusion, the last price is an important component of stock trading, providing insights into recent trading activity. However, it should be used in conjunction with other metrics and factors to make well-informed investment decisions. By conducting thorough stock analysis and considering a variety of indicators, traders can enhance their ability to navigate the dynamic world of stock markets and increase their chances of success.
What's Hot
Latest Articles
Related Post

By: • Finance

By: • Finance

By: • Finance

By: • Finance
By: • Finance

By: • Finance

By: • Finance

By: • Finance

By: • Finance

By: • Finance


By: • Finance


By: • Finance