Home>Finance>What Is Working Capital And How Do I Know If A Company Has Enough
Finance
What Is Working Capital And How Do I Know If A Company Has Enough
Table of Contents
A company has enough working capital if its current ratio is between 1.2 and 2.0, but you must strip out low-quality assets like stale inventory and compare the result specifically to the cash needed to cover the next 12 months of debt payments and operating expenses.
Why working capital analysis makes the 1.0 current ratio a trap
The textbook says positive working capital means short-term assets exceed short-term obligations, so a 1.0 ratio looks like breakeven. In practice, that ratio is the cliff edge. Consider a manufacturer with a short-term asset pool roughly double the seven-figure mark and short-term obligations just under that same threshold. That cushion, in the low six figures, looks fine until you read the stock note: a large chunk of the asset figure is finished goods that haven't moved in 14 months, and another portion is accounts receivable from a retailer that just filed for bankruptcy. The ratio is 1.05, but the company cannot pay its own payroll next week. The trap is treating stock and receivables as if they are as good as cash. A proper financial statements analysis forces you to reclassify every short-term asset by its conversion probability, not just its balance sheet date. If the goods on hand are obsolete, it is not an asset; it is a storage cost disguised as liquidity.
The cash conversion cycle as a reality check
Stop looking at the snapshot and start timing the movie. Calculate the cash conversion cycle: days goods sit unsold plus days sales outstanding minus days payable outstanding. If a company takes 90 days to sell its stock on hand, then another 60 days to collect the receivable, but only has 30 days to pay its suppliers, it needs 120 days of funding before the first dollar comes back in. That gap must be covered by equity or debt. Now compare that to the short-term liquidity ratio. A company with a 1.8 ratio but a 150-day cash conversion cycle is far more fragile than one with a 1.3 ratio and a 45-day cycle. Stress-test it by asking: what happens if sales drop 20% and customers stretch payments from 45 to 75 days? If the cycle balloons to 200 days, the ratio will look stable on paper for two quarters, then collapse when the cash runs out. The cycle tells you whether the balance sheet is a source of oxygen or a ticking timer.
When negative working capital is a superpower
Negative working capital usually screams danger, but in specific models, it is a sign of pricing power and a business model that scales revenue faster than costs. Think of a subscription software company that bills annually upfront: it collects a full-year fee in January for a year of service, but only owes the cost of goods sold over the next 12 months. Its short-term obligations include the deferred revenue, which inflates the denominator, but the cash is already in the bank. The liquidity ratio may read 0.8, yet the company is flush. Similarly, a large retailer like a grocery chain with negative working capital is often strong: it buys cereal on 60-day terms, sells it in 10 days, and holds the cash for 50 days before paying the supplier. That float is an interest-free loan. The distinction is the quality of the liability. If negative working capital comes from deferred revenue (cash collected, service owed) or accounts payable to suppliers who are dependent on you, it is a superpower. If it comes from unpaid taxes, overdue wages, or a drawn-down credit line that the bank is calling, it is distress. Check the liability composition: are the bills past due, or are they future obligations on your terms?
The debt maturity red flag
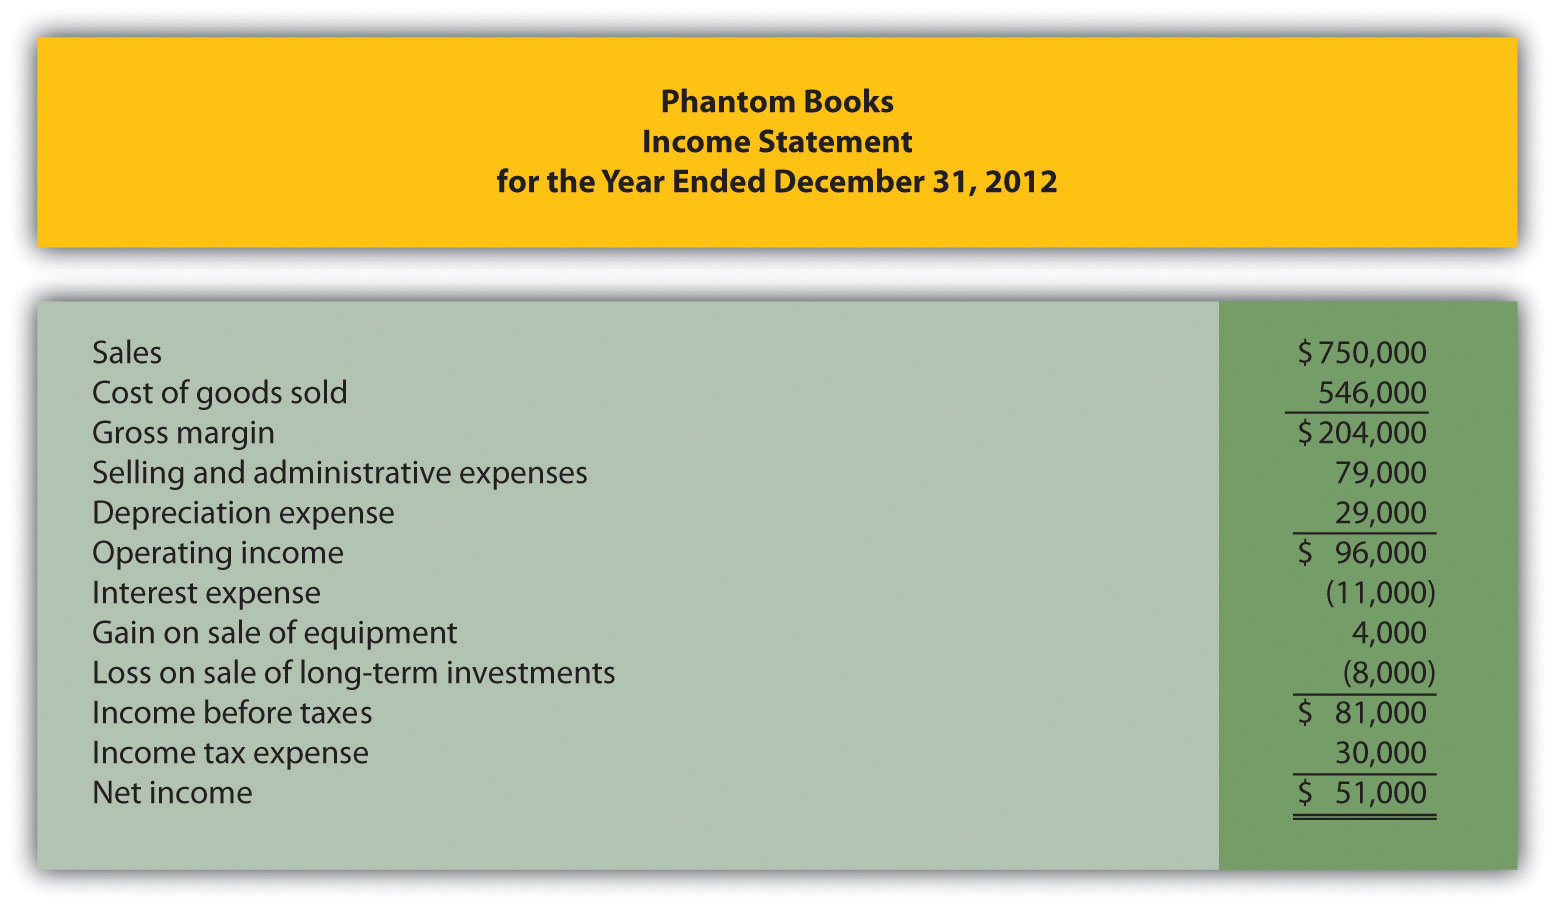
The most common failure is not a lack of working capital, it is a maturity mismatch. A company can have an eight-figure short-term asset base and mid-seven-figure short-term obligations, a healthy 1.67 ratio, but if a sum approaching the seven-figure mark inside that liability is a term loan due in 90 days that the bank has no intention of renewing, the company is insolvent. You must isolate the debt portion of short-term obligations and compare it directly to the most liquid assets: cash, marketable securities, and receivables that are truly collectible within 30 days. If the next 12 months of scheduled debt payments exceed your cash plus your highest-quality receivables, the ratio is a mirage. Run this scenario: a company has a mid-seven-figure cash balance, a smaller seven-figure sum in receivables (average collection 40 days), but owes a principal-and-interest figure above both combined on a revolver due next quarter. The ratio is 1.2, but the refinancing risk is existential. The real test is whether the company can survive a credit freeze, not whether it can survive a good month. The three main financial statements fit together here: the income statement shows whether operations generate cash, the balance sheet shows the stock of liquidity, and the cash flow statement reveals whether the debt service is covered by operating cash flow or by drawing down that same cash balance.
How to stress-test working capital before you invest
Do not read the ratio and move on. Book a two-hour session with the latest 10-Q and the earnings call transcript. Arrive at the balance sheet line items first, then open the notes to the financial statements. Enter through the footnotes on debt maturity, not the summary page. Skip the adjusted EBITDA slide entirely. Pull the cash conversion cycle for the last eight quarters and plot it yourself. If the cycle is lengthening and the quick ratio is below 0.5, flag the name and move to the next candidate. If the quick ratio is above 0.8 but short-term debt towers over cash and collectible receivables, check the credit facility maturity date on the SEC filing immediately. The official source for the most recent quarter is the company’s investor relations page under SEC filings; the numbers change every quarter, so use the filing date, not a third-party summary. The band for a healthy quick ratio sits between 0.8 and 1.5, set by the company’s own historical trend and the industry median published in the risk factors section. The raw dollar figure on a balance sheet is a starting point, not a verdict; adequacy is a function of timing, quality, and upcoming obligations. A business sitting at a 1.5 ratio can still fail a vendor invoice next Tuesday if its cash is locked in a warehouse full of obsolete parts.
No competitor will tell you this: a 1.0 current ratio is not breakeven, it is the point where a single 90-day debt maturity turns a solvent-looking balance sheet into an insolvent one overnight, and the ratio will not warn you until the filing after the default.
Frequently Asked Questions
Should I use the quick ratio instead of the short-term liquidity ratio?
Yes, but only as a first filter. The quick ratio (cash + marketable securities + receivables) divided by short-term obligations removes goods held for sale, which is the least liquid asset. If the quick ratio is below 0.5, you have a red flag regardless of the broader ratio.
How do I verify that stock on hand is actually salable?
Look at the turnover ratio for goods and compare it to industry averages. Then check the aging note in the 10-K or MD&A; if the company discloses a LIFO reserve or a write-down history, that tells you the real liquidation value is likely 50-70% of the book figure.
What if the company has positive working capital but negative operating cash flow?
That is a warning sign. It means earnings are not converting to cash, and the working capital is likely growing because receivables are piling up or unsold goods are building. Watch the cash conversion cycle trend over four quarters; if it is lengthening, the ratio is masking a deterioration.
Can a service business with no goods held for sale survive on a 0.8 ratio?
Often, yes. Service firms have no physical stock and minimal receivables if they bill upfront. Their short-term obligations are mostly accrued payroll and deferred revenue. The key question is whether the liabilities are interest-free and matched to future cash inflows, not whether the ratio exceeds 1.0.