Home>Finance>Forex Chart: Definition, Types, Uses In Trading

Finance
Forex Chart: Definition, Types, Uses In Trading
Published: November 26, 2023
Learn about forex charts and their definition, types, and uses in trading. Enhance your finance knowledge and improve your trading strategies.
(Many of the links in this article redirect to a specific reviewed product. Your purchase of these products through affiliate links helps to generate commission for LiveWell, at no extra cost. Learn more)
Forex Chart: Definition, Types, and Uses in Trading
When it comes to the world of finance, one term that often comes up is forex trading. Forex trading is the buying and selling of different currencies in the foreign exchange market. To make informed decisions while trading currencies, traders often rely on forex charts. In this blog post, we will dive into the definition of a forex chart, explore its different types, and understand its significance in trading.
Key Takeaways:
- Forex charts are graphical representations of currency price movements over a specific period.
- Common types of forex charts include line charts, bar charts, and candlestick charts.
What is a Forex Chart?
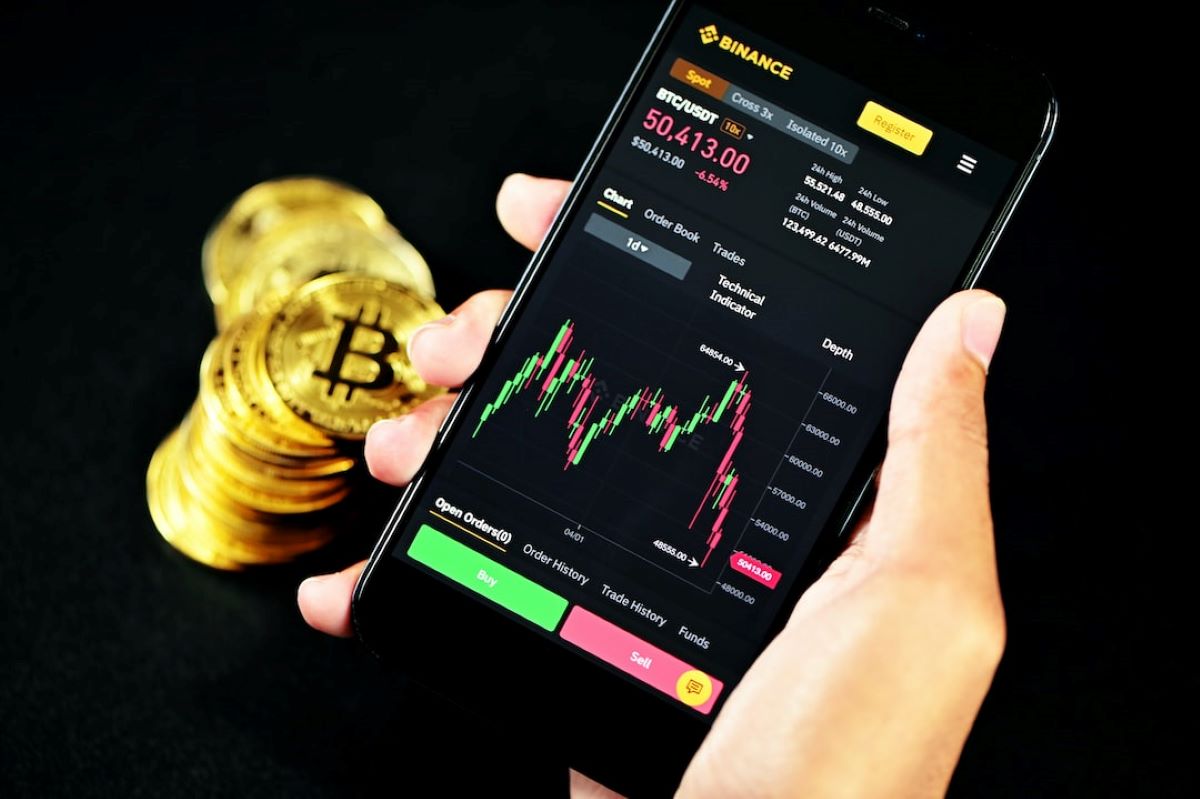
A forex chart is a visual representation of the price movements of a specific currency pair over a given period. It provides traders with a visual reference to identify trends, patterns, and potential opportunities in the market. By analyzing these charts, traders can make more informed decisions and develop effective trading strategies.
Types of Forex Charts:
There are several types of forex charts available, each with its own unique characteristics. Let’s explore the most commonly used ones:
- Line Charts: Line charts are the most basic and commonly used type of forex chart. They display the closing price of a currency pair over a specific period using a simple line. Line charts help traders identify general trends and provide a clear overview of the price movement.
- Bar Charts: Bar charts provide more detailed information compared to line charts. They display the opening, closing, high, and low prices of a currency pair for a given period using vertical bars. Bar charts allow traders to analyze price volatility and assess market sentiment.
- Candlestick Charts: Candlestick charts are widely used by forex traders due to their ability to provide a comprehensive view of price movements. These charts display the opening, closing, high, and low prices using candlestick-shaped graphical elements. Candlestick patterns can indicate potential trend reversals or continuations, helping traders make informed decisions.
The Uses of Forex Charts in Trading:
Forex charts play a crucial role in trading and offer several benefits to traders:
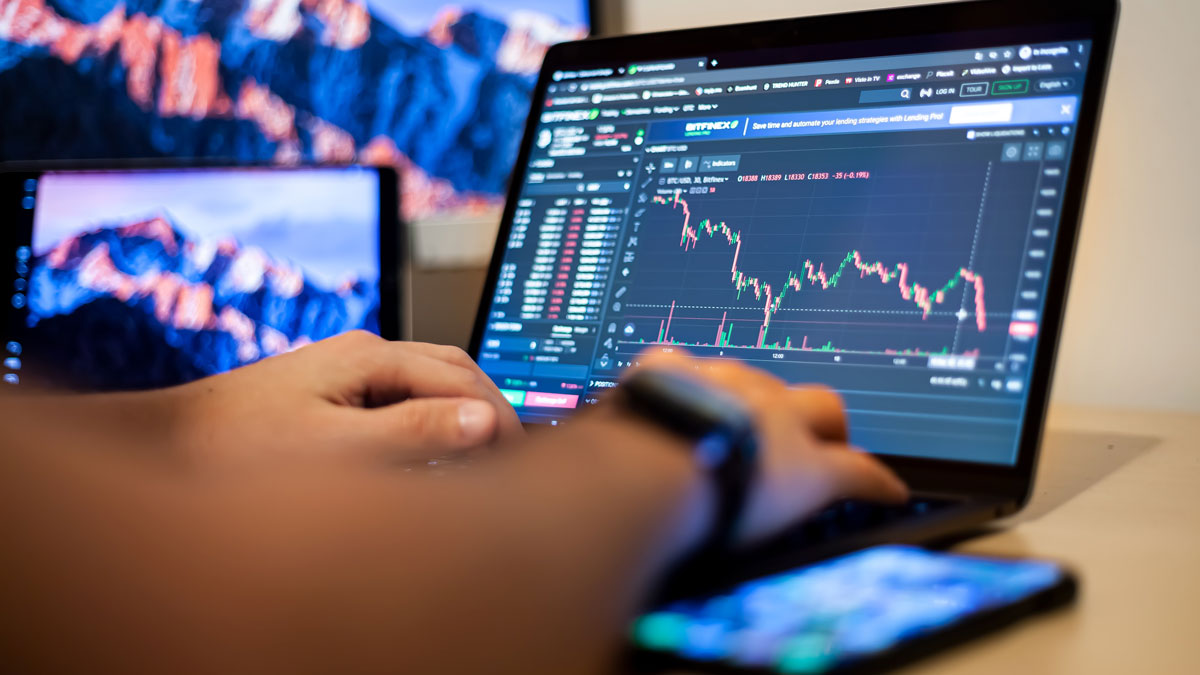
- Technical Analysis: Forex charts are essential for technical analysis, enabling traders to identify trends, support and resistance levels, and patterns. This analysis helps traders make predictions about future price movements.
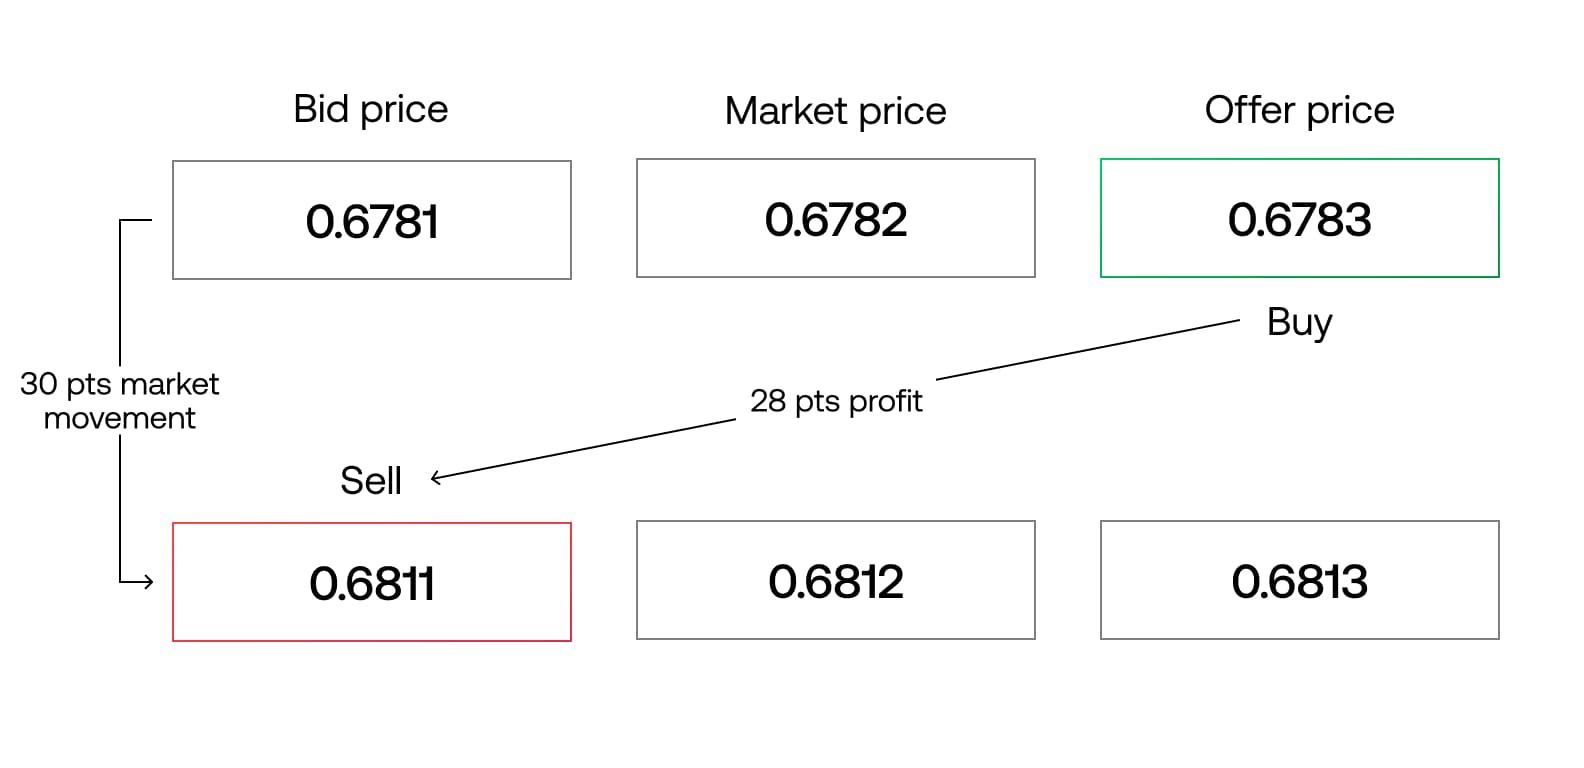
- Timing Trade Entries and Exits: By analyzing forex charts, traders can time their entry and exit points strategically. Charts provide insights into the best moments to buy or sell currencies, maximizing profit potential and minimizing risks.
- Risk Management: Forex charts allow traders to set realistic and effective stop-loss and take-profit levels. These levels are determined by analyzing price movements, enabling traders to manage risk efficiently.
- Developing Trading Strategies: Forex charts help traders develop and fine-tune trading strategies. By studying historical price data, traders can identify patterns and trends that can be utilized to develop successful trading approaches.
In conclusion, forex charts are powerful tools that provide traders with valuable insights into currency price movements. By analyzing these charts, traders can make informed decisions, time their trades effectively, and manage risk efficiently. They act as a roadmap in the world of forex trading, helping traders navigate the volatile market and achieve their financial goals.
What's Hot
Latest Articles
Related Post
By: Sarah Reyes • Finance
By: • Finance

By: • Finance

By: • Finance
By: • Finance
By: • Finance

By: • Finance
By: • Finance

By: • Finance

By: • Finance