
Finance
Vertical Line Charting Definition And Example
Published: February 16, 2024
Learn the definition and see examples of vertical line charting in finance. This helpful tool visually represents financial data for easy analysis and decision-making.
(Many of the links in this article redirect to a specific reviewed product. Your purchase of these products through affiliate links helps to generate commission for LiveWell, at no extra cost. Learn more)
Vertical Line Charting Definition and Example: A Comprehensive Guide
Gaining a thorough understanding of financial concepts and tools is crucial for anyone looking to make informed decisions in the world of finance. Among the many tools used in financial analysis, vertical line charting stands out as a fundamental and powerful method. In this blog post, we’ll delve into the definition and provide an example of vertical line charting, helping you grasp its significance and how it can be implemented to improve financial analysis.
Key Takeaways:
- Vertical line charting is a graphical representation of financial data that displays price movements over a specific time period, using vertical lines to indicate key points.
- By analyzing vertical line charts, investors can identify trends, support and resistance levels, and potential entry and exit points for their trades.
Understanding Vertical Line Charting
Vertical line charting is a technique used in technical analysis to visualize the movement of prices over time. It is commonly used in various financial markets, such as stocks, commodities, currencies, and cryptocurrencies.
The chart itself consists of vertical lines, each representing a specific time period. The height of the line represents the price range for that period, with the top and bottom points indicating the highest and lowest prices reached during that time frame. Typically, the lines are color-coded to provide further insights into the price movements or to highlight specific patterns.
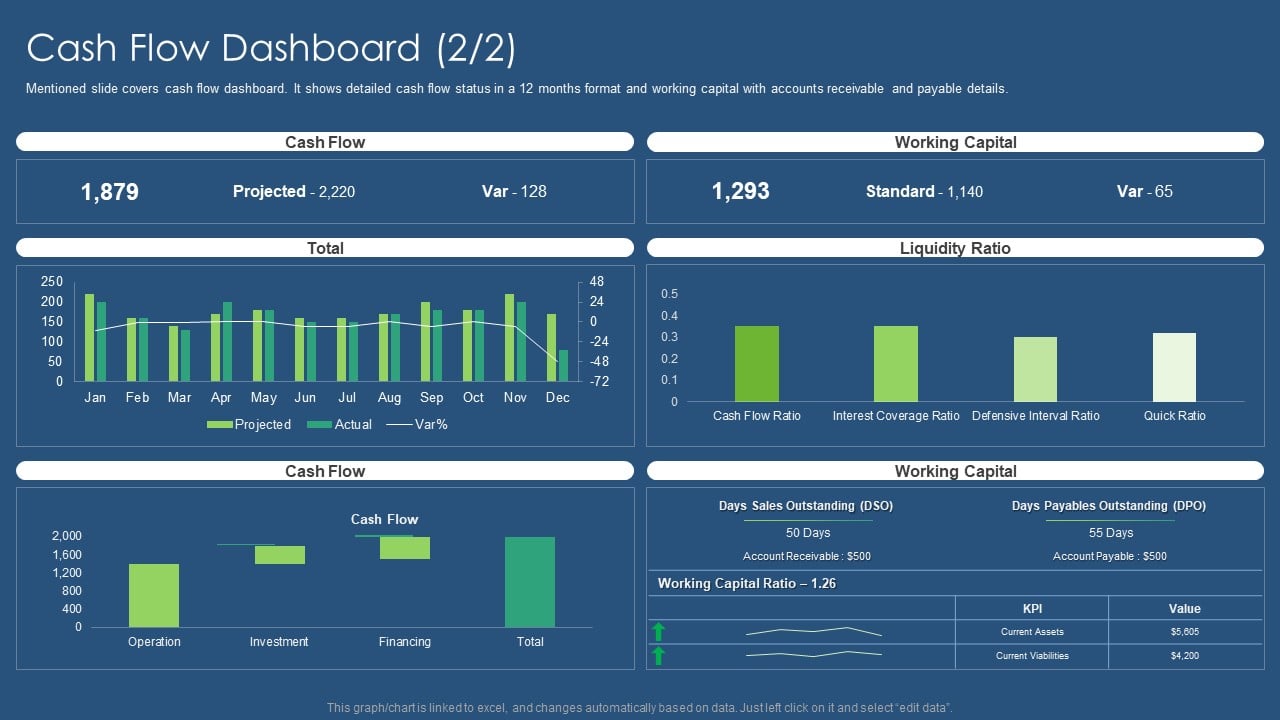
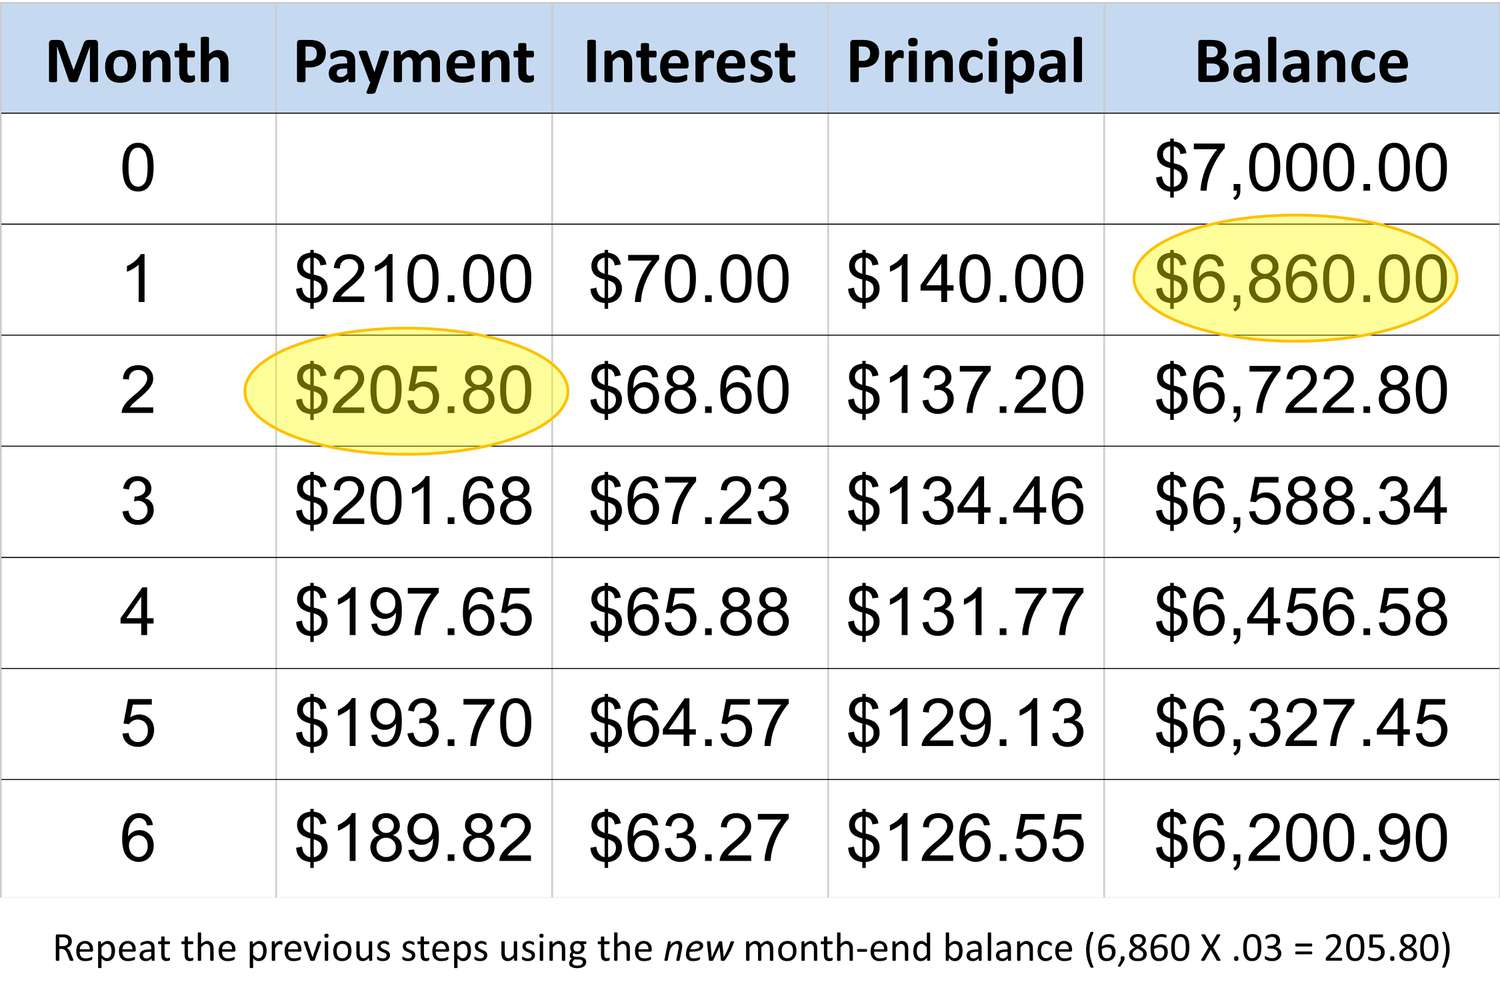
Let’s consider an example: Suppose you’re analyzing the historical price data of a company’s stock over a period of six months. By plotting vertical lines on a chart, you can now visualize the price ranges for each day within that time frame. This visualization can help you detect patterns, such as upward or downward trends, consolidation periods, or breakouts.
Vertical line charting is a valuable tool for technical analysts, as it provides a concise and intuitive way to interpret price action and make predictions about future movements. By recognizing patterns and understanding key support and resistance levels, investors can optimize their entry and exit points, enhancing their trading strategies.
Implementing Vertical Line Charting for Financial Analysis
Now that we have an understanding of vertical line charting, let’s explore how it can be applied for financial analysis:
- Plotting Price Movements: Use vertical line charting to visually represent the price movements of a specific asset over a chosen time period. This will provide a clear picture of how the price has evolved and enable you to spot trends or patterns.
- Identifying Support and Resistance Levels: By analyzing the vertical lines on the chart, you can pinpoint levels where the price has historically had difficulty breaking through (resistance) or where it has found support. These levels are essential for making trading decisions.
- Recognizing Patterns: Vertical line charting allows you to identify common chart patterns, such as triangles, head and shoulders, or double tops/bottoms. These patterns can signal potential changes in the price direction, allowing traders to take advantage of opportunities.
- Timing Entry and Exit Points: Armed with the insights gained from vertical line charting, you can better time your entry and exit points for trades. By identifying levels of price consolidation or potential breakouts, you can optimize your buy and sell decisions.
By incorporating vertical line charting into your financial analysis, you can gain a deeper understanding of market trends and price patterns, enabling you to make more informed decisions and potentially increase your returns.
In Conclusion
Vertical line charting is a powerful tool in financial analysis that enables investors to visualize price movements and identify patterns and key levels of support and resistance. By incorporating vertical line charting techniques into your analysis, you can gain valuable insights to optimize your trading strategies and make more informed investment decisions. Increasing your knowledge and proficiency in this technique can provide a competitive edge in the challenging world of finance.
What's Hot
Latest Articles
Related Post

By: • Finance

By: • Finance

By: • Finance


By: • Finance


By: • Finance

By: • Finance


By: • Finance

By: • Finance

By: • Finance
By: • Finance