Home>Finance>Line Chart: Definition, Types, Examples, How To Make In Excel

Finance
Line Chart: Definition, Types, Examples, How To Make In Excel
Published: December 18, 2023
Learn about line charts in finance, including their definition, various types, real-life examples, and step-by-step instructions on creating them in Excel.
(Many of the links in this article redirect to a specific reviewed product. Your purchase of these products through affiliate links helps to generate commission for LiveWell, at no extra cost. Learn more)
Line Chart: Definition, Types, Examples, and How to Make in Excel
Welcome to another informative blog post in our “FINANCE” category! Today, we are going to dive into the world of line charts – a powerful tool in data visualization for tracking trends and presenting information in a clear and concise manner. Whether you are a finance professional, a business owner, or simply someone interested in understanding data analysis, this blog post will provide you with everything you need to know about line charts and how to create them using Microsoft Excel.
Key Takeaways:
- A line chart is a visual representation of data points connected by straight lines, commonly used to track trends over time.
- Line charts are excellent for displaying continuous data, highlighting patterns, and identifying relationships between variables.
Now, let’s delve deeper into the world of line charts. So, what exactly is a line chart? Well, a line chart, also known as a line graph, is a type of chart that displays information as a series of data points connected by straight lines. It is an effective way to visualize data trends over time, making it easier for us to analyze and understand complex datasets. Whether you want to track stock market performance, monitor business growth, or compare sales figures, line charts are the go-to choice.
Line charts can be used to showcase various types of data, such as:
- Time-series data: Plotting data points against time, such as daily, monthly, or yearly data.
- Categorical data: Comparing data points across different categories, such as sales performance by product categories.
- Continuous data: Displaying data points with numerical values, such as temperature fluctuations.
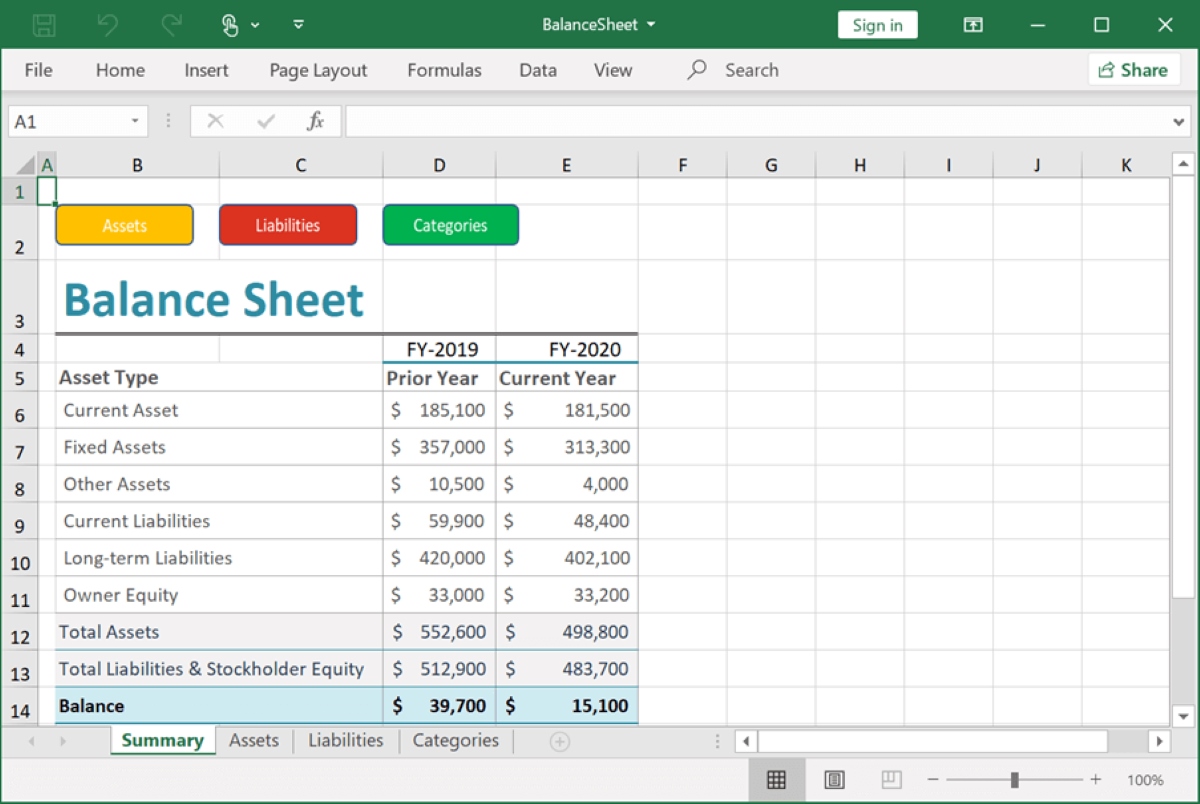
Creating a line chart in Microsoft Excel is a breeze. Just follow these simple steps:
- Open Microsoft Excel and input your data in a spreadsheet.
- Select the data range you want to include in your line chart.
- Navigate to the “Insert” tab and click on the “Line” chart icon.
- Choose the desired line chart type, such as a simple line, stacked line, or 3D line chart.
- Customize your chart by adding titles, labels, gridlines, and other formatting options.
- Voila! Your line chart is ready to unveil insightful trends and patterns in your data.
Let’s take a look at a real-life example to demonstrate the power of line charts. Imagine you own a small retail business and want to analyze the sales performance of your top three products over the past year. By plotting the sales data on a line chart, you can quickly identify trends, peak seasons, and potential areas for improvement. This valuable insight will help you make informed decisions and drive your business forward.
In conclusion, line charts are an invaluable tool for data visualization and analysis. Whether you are a finance professional, a business owner, or a data enthusiast, mastering the art of line charts can significantly enhance your decision-making abilities. So, why wait? Start exploring the world of line charts today and unlock the hidden potential of your data!
What's Hot
Latest Articles
Related Post

By: • Finance


By: • Finance

By: • Finance
By: • Finance

By: • Finance

By: • Finance

By: • Finance

By: • Finance


By: • Finance

By: • Finance

By: • Finance

By: • Finance