Finance
What Is Average Volume In Stocks
Published: January 18, 2024
Discover what average volume in stocks means in the world of finance and how it can impact your investment decisions.
(Many of the links in this article redirect to a specific reviewed product. Your purchase of these products through affiliate links helps to generate commission for LiveWell, at no extra cost. Learn more)
Table of Contents
Introduction
Welcome to the world of stock trading! If you’re new to the game or even if you have some experience, you’ve probably come across the term “average volume” when researching different stocks. Average volume is a crucial metric that provides valuable insights into the trading activity of a stock.
Have you ever wondered why some stocks seem to have more trading activity while others are relatively quiet? Average volume helps answer that question. It is an important indicator that helps investors and traders understand the level of interest and liquidity in a particular stock.
In this article, we will explore the concept of average volume, its importance in stock trading, how it is calculated, factors that affect it, how to interpret it, and its uses and limitations.
Understanding average volume is essential for making informed investment decisions. By the end of this article, you will have a solid understanding of this important metric and how it can enhance your trading strategies.
Definition of Average Volume
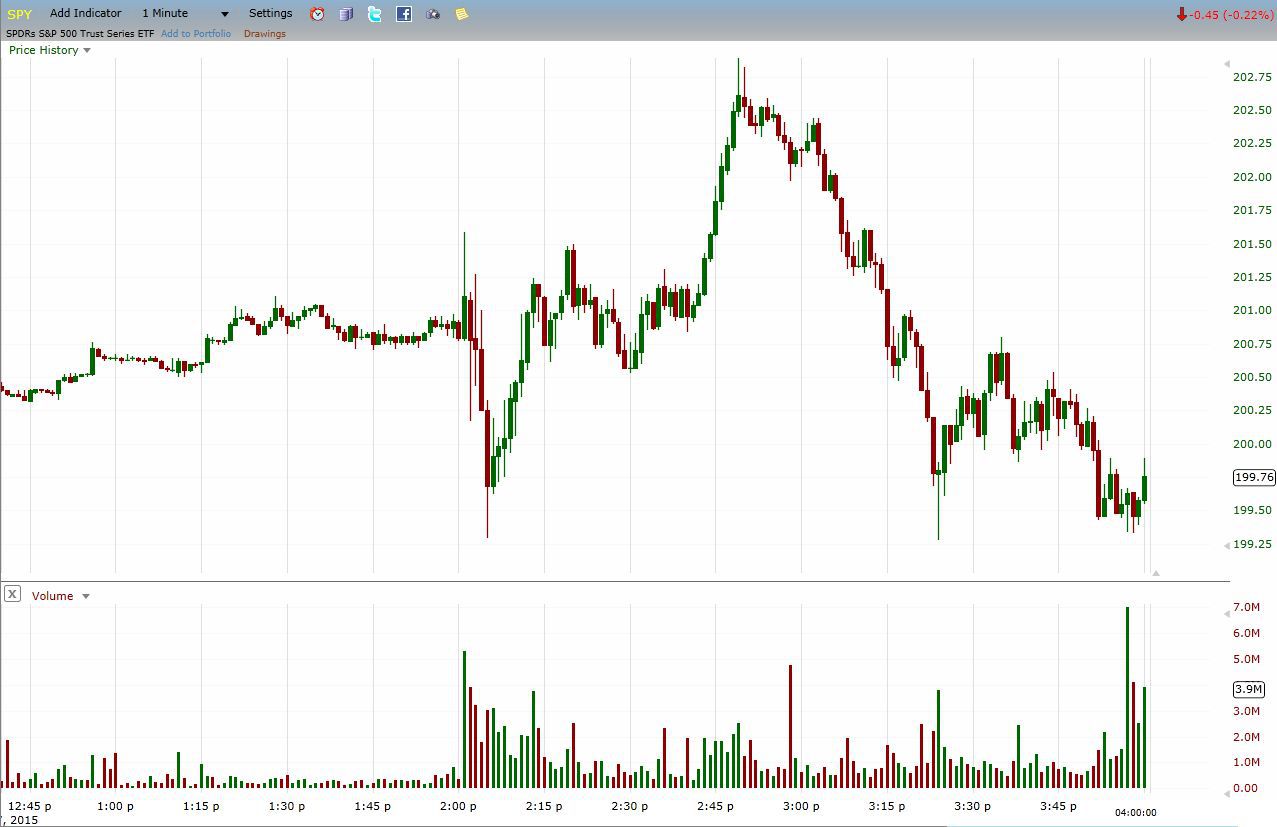
Before we dive into the importance and calculations of average volume, let’s start by defining what exactly average volume is. Average volume, also known as average daily trading volume, refers to the average number of shares traded in a stock over a specific period of time, usually measured in days or weeks.
It represents the total number of shares bought and sold during each trading session for a given period and provides insights into the overall liquidity and interest in a stock.
Average volume is typically calculated by taking the sum of the volumes traded for each day during the defined period and dividing it by the number of trading days in that period.
For example, let’s say we want to calculate the average volume of a particular stock over the past month. We would sum up the trading volumes of each trading day in that month and then divide it by the number of trading days in that month.
It’s important to note that average volume is different from total volume. Total volume refers to the cumulative number of shares traded during a single trading session, whereas average volume considers the average amount of shares traded over a certain time frame.
Average volume is commonly used as a benchmark to compare the trading activity of different stocks in a particular market or industry. By analyzing average volume, traders and investors can gain insights into the level of liquidity and market interest in a specific stock.
Importance of Average Volume in Stocks
Average volume plays a crucial role in stock trading and is a valuable tool for investors and traders. Here are some key reasons why average volume is important:
- Liquidity: Liquidity refers to the ease with which a stock can be bought or sold without significantly impacting its price. Stocks with higher average volume tend to have better liquidity, meaning there are more buyers and sellers in the market. This allows traders to enter and exit positions more easily, improving the overall trading experience.
- Price Stability: Average volume can also impact the price stability of a stock. Stocks with lower average volume can be more volatile, as a smaller number of trades can lead to larger price swings. Conversely, stocks with higher average volume tend to have more stable prices, as there is a larger pool of buyers and sellers that helps smooth out price fluctuations.
- Confirmation of Price Movements: Average volume can provide confirmation of price movements. When the price of a stock moves up or down with above-average volume, it indicates that there is stronger market participation and conviction behind the price move. In contrast, price movements with below-average volume may lack sufficient market interest and therefore could be less reliable.
- Identifying Trends and Breakouts: Average volume can help identify trends and breakouts. When a stock experiences a significant increase in volume alongside a price breakout, it suggests a strong trend and can signal a potential opportunity for traders. Similarly, declining volume during a trend can indicate weakening momentum or a potential reversal.
- Market Participation: Average volume provides insights into the level of market participation in a stock. Stocks with higher average volume tend to attract more institutional investors and traders, which can indicate confidence in the company and its prospects. On the other hand, stocks with lower average volume might have limited interest and may not be actively followed by market participants.
By understanding the importance of average volume, traders and investors can effectively gauge the liquidity, price stability, and market participation of a stock. This knowledge can help guide their trading strategies and improve their decision-making process.
Calculation of Average Volume
Calculating the average volume of a stock is a straightforward process. It involves adding up the trading volumes of each trading day over a specified period and dividing it by the number of trading days in that period.
Here is a step-by-step guide on how to calculate average volume:
- Choose a specific period for which you want to calculate the average volume. It could be a month, quarter, or any other time frame that suits your analysis.
- Record the trading volume for each trading day within the chosen period. This information can be found on financial websites or trading platforms.
- Sum up the trading volumes for all the trading days within the chosen period.
- Divide the total sum of trading volume by the number of trading days in the period to get the average volume.
For example, let’s say you want to calculate the average volume of a stock over the past 20 trading days. You would add up the trading volumes of each trading day over those 20 days and then divide it by 20 to get the average volume for that particular stock.
It’s worth mentioning that some trading platforms and financial websites provide pre-calculated average volume data, making it easier for investors and traders to access this information without performing manual calculations.
The calculation of average volume is not only useful for analyzing individual stocks but can also be applied to broader market indices or specific sectors to gain insights into overall market trends and investor sentiment.
Keep in mind that the period chosen to calculate average volume depends on the desired level of analysis. Shorter time frames, such as daily or weekly averages, can provide more granular information, while longer time frames, such as monthly or quarterly averages, can help identify broader trends.
By calculating the average volume, investors and traders can gain a better understanding of the trading activity and liquidity of a stock, enabling them to make more informed decisions.
Factors Affecting Average Volume
Several factors can impact the average volume of a stock. By considering these factors, traders and investors can better understand the dynamics behind the trading activity of a particular stock. Here are some key factors that can affect average volume:
- News and Market Sentiment: Positive or negative news about a company or the overall market can significantly impact trading volume. Major news events, earnings reports, economic data, or geopolitical developments can drive increased trading activity as investors react to changes in sentiment and adjust their positions.
- Market Conditions: Market conditions play a crucial role in determining average volume. During periods of high volatility or market uncertainty, trading volume tends to increase as traders and investors actively buy and sell stocks. Conversely, during periods of low volatility or holiday seasons, average volume may decrease as market participants take a break from trading.
- Company-Specific Events: Specific events related to a company, such as product launches, mergers and acquisitions, management changes, or regulatory actions, can have a significant impact on average volume. These events often generate increased interest and trading activity as investors reassess the company’s prospects and make investment decisions accordingly.
- Industry or Sector Trends: Trends within specific industries or sectors can influence average volume. For example, if there is a growing interest in renewable energy stocks, the average volume of companies within that sector may increase due to increased investor attention and trading activity.
- Market Participants: The type of market participants in a stock can affect its average volume. Stocks with a large number of institutional investors, such as mutual funds or pension funds, tend to have higher average volumes. Institutional investors often trade in large volumes, which contributes to the overall average volume of a stock.
It’s important to note that these factors can interact with one another, and their impact on average volume may vary depending on the specific circumstances. Additionally, each stock may be affected differently by these factors, so it’s crucial to assess them within the context of the individual stock being analyzed.
By considering the factors that influence average volume, investors and traders can gain insights into the underlying dynamics of a stock’s trading activity. This knowledge can be valuable in assessing potential risks and opportunities in the market.
Interpretation of Average Volume
Interpreting average volume is an important skill for traders and investors, as it can provide crucial insights into the trading activity and market sentiment surrounding a stock. Here are some key factors to consider when interpreting average volume:
- Relative Comparison: Comparing the average volume of a stock to its historical average volume or to the average volume of other stocks in the same industry or sector can provide valuable context. If the current average volume is significantly higher than the historical average, it may indicate increased interest or a surge in trading activity.
- Volume Patterns: Analyzing patterns in the average volume can reveal valuable information. Consistently high or increasing average volume levels over time may suggest sustained market interest or a growing trend. On the contrary, declining average volume may signal reduced interest or potential weakening of the stock’s momentum.
- Volume Spikes: Rapid increases in average volume can indicate significant market events or news that have attracted attention to a stock. High volume spikes often coincide with important announcements, earnings releases, or major market developments. Traders should look for volume spikes to confirm the strength of price movements and assess market sentiment.
- Volume Divergence: Volume divergence occurs when the price of a stock is moving in one direction while average volume is moving in the opposite direction. For example, if a stock price is rising but average volume is decreasing, it may suggest that the price increase is not supported by strong market participation and could be a warning sign of a potential reversal or false breakout.
- Confirmation with Technical Analysis: Volume analysis is often used in conjunction with other technical analysis indicators. For example, higher-than-average volume accompanying a breakout above a key resistance level may provide confirmation of the strength of the breakout. Similarly, low volume during a consolidation phase may indicate a lack of conviction and could signal a potential price reversal.
It is essential to remember that average volume should not be analyzed in isolation but in combination with other technical indicators, fundamental analysis, and market conditions. The interpretation of average volume should take into account the specific context of the stock being analyzed and the overall market trends.
By understanding how to interpret average volume, traders can gain insights into market sentiment, identify potential trading opportunities, and make more informed decisions based on the underlying dynamics of trading activity.
Uses of Average Volume in Stock Trading
Average volume is a valuable tool for traders in their analysis and decision-making process. Here are some key uses of average volume in stock trading:
- Identifying Breakouts and Reversals: Average volume can be used to identify potential breakouts or reversals in stock prices. When a stock price breaks out above a resistance level with above-average volume, it suggests strong buying interest and can indicate a potential upward trend. Conversely, if a stock price reverses with above-average volume, it could signal a shift in sentiment and a possible trend reversal.
- Confirming Price Movements: Average volume can provide confirmation of price movements. When a stock price moves in a particular direction with increasing volume, it indicates stronger market participation and adds credibility to the move. If price movements occur with low volume, it may suggest less conviction and could be a warning sign of potential false breakouts or reversals.
- Assessing Liquidity: Average volume helps traders assess the liquidity of a stock. Stocks with higher average volume tend to have better liquidity, allowing for easier buying and selling at desired prices. Traders often prefer stocks with sufficient liquidity to avoid slippage or difficulty in executing trades.
- Detecting Market Interest: Average volume can indicate the level of market interest in a particular stock. Higher average volume suggests greater market attention and may attract more traders and investors. Stocks with higher market interest tend to have more reliable price trends and can provide more trading opportunities.
- Setting Risk Management Strategies: Average volume can help traders set risk management strategies by determining the appropriate position sizes. Higher average volume usually indicates lower slippage and tighter bid-ask spreads, allowing for larger trading positions. Conversely, lower average volume may require smaller position sizes to manage potential liquidity risk.
By incorporating average volume into their trading strategies, traders can enhance their ability to identify potential trading opportunities, confirm price movements, manage risks effectively, and make more informed decisions. It is important to combine average volume analysis with other technical indicators, fundamental analysis, and market conditions for comprehensive trading insights.
Remember, average volume is not a standalone indicator, but a valuable tool that can complement your analysis and assist you in making informed trading decisions.
Limitations of Average Volume
While average volume is a useful metric in stock trading, it is important to be aware of its limitations. Here are some key limitations to consider when using average volume:
- Delayed Volume Data: Average volume calculations are based on historical trading data, which can be subject to delays in reporting. This means that the average volume figure may not reflect the most up-to-date market activity, particularly during periods of high volatility or fast-moving markets.
- Seasonal and Event-Driven Distortions: Average volume calculations may be distorted by seasonal factors or specific events. For example, during holiday periods or when certain market participants are on vacation, trading volume may be lower than usual, leading to artificially lower average volume figures. Similarly, major news events or earnings releases can cause volume spikes that skew the average volume calculations.
- Company-Specific Factors: Average volume does not take into account company-specific factors that may impact trading activity. Factors such as product releases, management changes, regulatory issues, or litigation can have a significant impact on the trading volume of a stock. It is important to consider these factors in conjunction with average volume analysis when assessing the overall trading dynamics of a stock.
- Relative Volume Consideration: Average volume alone may not provide a comprehensive picture of the trading activity of a stock. It is important to compare the average volume to the stock’s recent trading patterns and volume history. A stock with a lower average volume may still have significant trading activity if it experiences volume spikes or is part of a niche industry or sector.
- Market-wide Factors: Average volume does not account for broader market conditions or trends. It is possible for an individual stock to show a high average volume, but if the overall market is experiencing low trading activity, it may diminish the relative significance of the stock’s average volume figure.
It is crucial to use average volume in conjunction with other technical indicators, fundamental analysis, and a comprehensive understanding of market conditions. By considering these factors, traders can better interpret average volume and the implications it may have for their trading strategies.
While average volume provides valuable insights into trading activity, it is just one piece of the puzzle in analyzing stocks. It is important to conduct thorough research and analysis to make informed trading decisions, rather than relying solely on average volume figures.
Conclusion
Average volume is a vital tool for traders and investors in the world of stock trading. Understanding and analyzing average volume can provide valuable insights into liquidity, market sentiment, and trading activity surrounding a stock.
By calculating and interpreting average volume, traders can identify potential breakouts, confirm price movements, assess market interest, and set risk management strategies more effectively. It serves as a guide to understand market dynamics and make informed trading decisions.
However, it is essential to recognize the limitations of average volume. Delays in reporting, seasonal distortions, company-specific factors, and market-wide influences can impact the reliability and accuracy of average volume figures. Therefore, it is important to consider average volume in conjunction with other technical indicators, fundamental analysis, and market conditions for a comprehensive understanding of stock dynamics.
Ultimately, the use of average volume as part of a comprehensive analysis allows traders to gain better insights into the trading activity of stocks, make more informed decisions, and enhance their overall trading strategies.
Remember, successful trading requires a combination of technical skills, fundamental knowledge, and a deep understanding of market conditions. Average volume serves as a valuable tool in this process, but it should be used alongside other relevant data points to yield the best results.
What's Hot
Latest Articles
Related Post

By: • Finance

By: • Finance


By: • Finance

By: • Finance

By: • Finance


By: • Finance

By: • Finance

By: • Finance

By: • Finance

By: • Finance
By: • Finance

By: • Finance

By: • Finance