
Finance
What Does Volume Mean Stocks
Published: January 18, 2024
Discover the meaning of volume in stocks and its significance in finance. Learn how volume impacts stock prices and trading strategies.
(Many of the links in this article redirect to a specific reviewed product. Your purchase of these products through affiliate links helps to generate commission for LiveWell, at no extra cost. Learn more)
Table of Contents
Introduction
When it comes to stock trading, one of the key factors that investors and traders closely monitor is volume. Volume refers to the number of shares or contracts traded in a particular asset within a given period of time. It is an essential component of technical analysis and plays a significant role in understanding the behavior of the market.
Understanding the concept of volume and its significance in stock trading is crucial for both seasoned investors and newcomers to the financial markets. Volume provides valuable insights into market trends, liquidity, and the overall health of a stock. By analyzing volume patterns, traders can make informed decisions about when to enter or exit positions.
In this article, we will delve into the definition of volume in stocks, explore its importance in stock trading, examine the factors influencing volume, understand how it is measured, and learn how to interpret volume patterns. We will also explore volume analysis strategies and discuss the limitations of relying solely on volume analysis for stock trading decisions.
By the end of this article, you will have a comprehensive understanding of volume in stocks and how it can be used as a tool in your trading arsenal.
Definition of Volume in Stocks
Volume in stocks refers to the number of shares or contracts traded in a specific security within a given time period. It represents the total activity and interest in a particular stock or market at any given point in time. Volume is typically measured on a daily basis but can also be analyzed over longer timeframes to identify trends and patterns.
Volume is represented as the total number of shares or contracts exchanged during a trading day. For example, if 100,000 shares of XYZ stock are traded in a single day, the volume for that day would be 100,000.
Volume is an essential component of technical analysis as it provides valuable insights into the strength of price movements and the overall sentiment of market participants. High volume often indicates increased interest and participation, while low volume suggests a lack of enthusiasm or limited market activity.
It is important to note that volume alone does not provide complete information about the direction or magnitude of price movements. It must be analyzed in conjunction with price data and other technical indicators to make informed trading decisions.
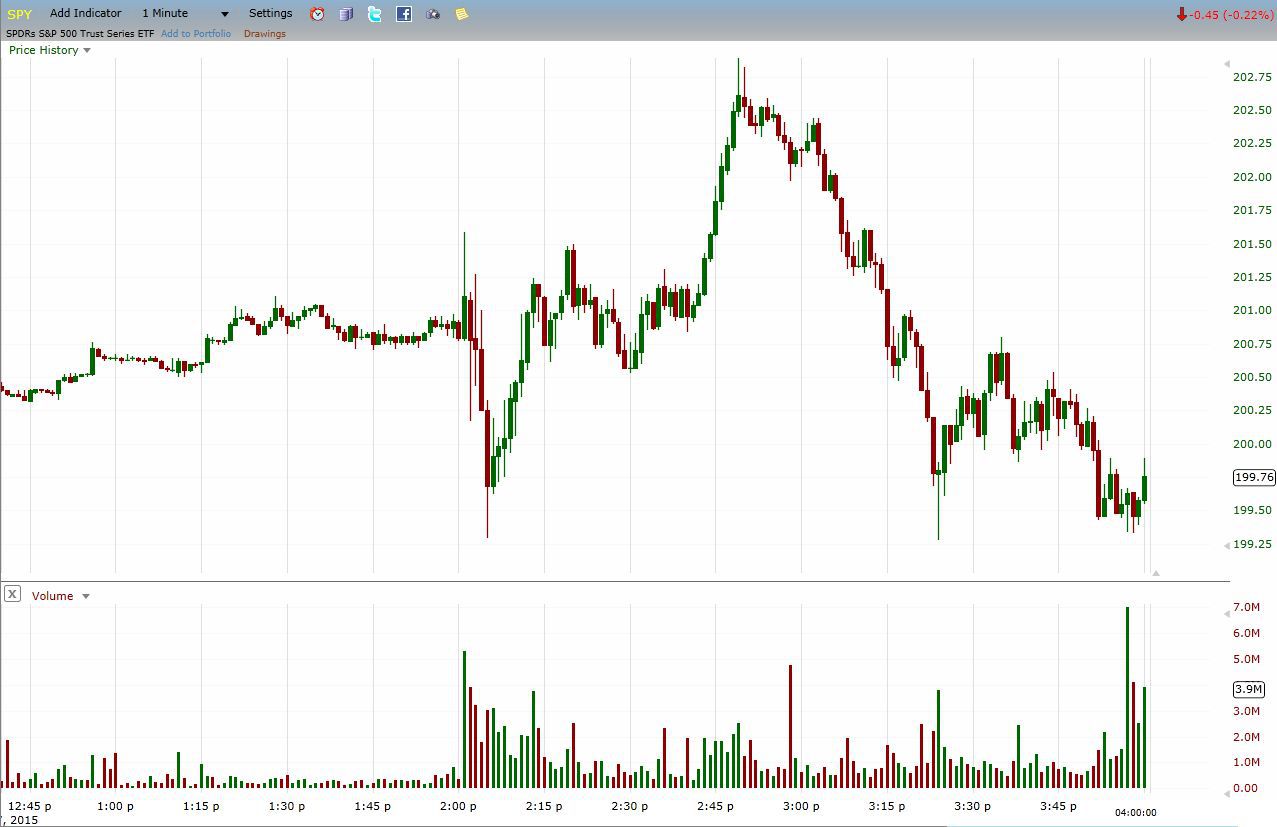
Volume is commonly displayed on stock charts in the form of vertical bars positioned below the price chart. The height of each bar represents the volume traded during a specific time period, while the width of the bar represents the duration of that period.
By analyzing volume patterns, traders can identify periods of accumulation or distribution, spot potential market reversals, and gauge the strength of price movements. Volume analysis is especially useful in confirming or contradicting price trends and providing insights into market sentiment.
Now that we have a clear understanding of what volume in stocks represents, let’s explore why volume is considered a vital aspect of stock trading and how it can influence trading decisions.
Importance of Volume in Stock Trading
Volume is a crucial element in stock trading, providing valuable insights into market dynamics and helping traders make informed decisions. Here are some key reasons why volume is important in stock trading:
- Confirmation of Price Movements: Volume analysis helps confirm the validity of price movements. When prices are rising or falling on high volume, it suggests that the market participants are actively participating and supporting the price trend. Conversely, if prices are moving in a certain direction with low volume, it may indicate a lack of conviction and potential weakness in the trend.
- Identification of Accumulation and Distribution: Volume can help identify phases of accumulation or distribution in a stock. High volume during an uptrend indicates accumulation, as buyers are actively entering positions. Conversely, high volume during a downtrend suggests distribution, as sellers are offloading their shares. By analyzing volume patterns, traders can identify potential turning points in the market.
- Confirmation of Breakouts and Breakdowns: Volume plays a crucial role in confirming breakouts and breakdowns. When a stock breaks out of a key resistance level with high volume, it suggests strong buying interest and validates the breakout. On the other hand, if a stock breaks down through a crucial support level on high volume, it indicates significant selling pressure and signals a potential downtrend.
- Assessment of Market Liquidity: Volume provides insights into the liquidity of a stock. Highly liquid stocks typically have high trading volumes, which means that there is a larger pool of buyers and sellers. This ensures that traders can enter or exit positions with minimal slippage and tight bid-ask spreads.
- Confirmation of Reversal Patterns: Volume analysis can confirm various reversal patterns in technical analysis, such as the double top or head and shoulders. When prices form these reversal patterns with a significant increase in volume, it provides additional confirmation that a reversal is likely to occur.
By incorporating volume analysis into their trading strategies, traders can gain a deeper understanding of market dynamics, identify potential trading opportunities, and increase the probability of making profitable trades. However, it is important to consider other technical indicators and factors alongside volume to make well-rounded trading decisions.
Now that we understand the importance of volume in stock trading, let’s explore the factors that can influence volume in stocks.
Factors Affecting Volume in Stocks
Volume in stocks is influenced by a variety of factors that can impact the level of trading activity and investor sentiment. Understanding these factors can help traders interpret volume patterns and make well-informed trading decisions. Here are some key factors that affect volume in stocks:
- News and Market Events: Significant news announcements, earnings reports, economic data releases, and geopolitical events can impact trading volume. Positive news often triggers an increase in buying activity, leading to higher volume, while negative news can result in increased selling and higher volume on the sell side.
- Price Volatility: Higher price volatility can attract more traders and investors, leading to increased trading volume. Stocks with high volatility tend to experience larger price swings and therefore generate more interest among market participants.
- Market Sentiment: Market sentiment, which reflects the overall psychological attitude of investors, can greatly affect trading volume. During bullish periods when investors are optimistic, volume tends to increase as more buyers enter the market. Conversely, during bearish periods, volume can decline as selling pressure intensifies.
- Liquidity of the Stock: Stocks with higher liquidity tend to have higher trading volumes. Liquidity refers to the ease of buying or selling a stock without causing a significant impact on its price. Stocks with large market capitalizations and substantial trading volumes are generally more liquid.
- Market Participants’ Behavior: The behavior of various market participants, such as institutional investors, retail traders, and market makers, can influence trading volume. Institutional investors, for example, tend to trade in large volumes, which can significantly impact the overall volume of a stock.
- Trading Strategies: Different trading strategies can also impact volume. For example, day traders who engage in frequent buying and selling can contribute to higher volume, while long-term investors may have a smaller impact on daily trading volume.
- Seasonal and Cyclical Factors: Trading volume can also be influenced by seasonal and cyclical factors. For example, trading volume tends to be lower during holiday periods or during the summer months when market participants may be on vacation.
It’s important for traders to consider these factors and analyze volume patterns in conjunction with other technical indicators to gain a comprehensive understanding of market dynamics.
Now that we have explored the factors influencing volume in stocks, let’s take a look at how volume is measured in the financial markets.
How Volume is Measured in Stocks
Volume in stocks is measured by tracking the number of shares or contracts exchanged during a specific time period. This data is readily available and can be easily accessed by traders and investors through various financial platforms and charting tools.
There are two primary methods used to measure volume in stocks:
- Tick Volume: Tick volume measures the number of price changes or trades that occur during a given time period. Each time a trade is executed at a specific price, it adds to the tick volume count. Tick volume provides a more granular view of trading activity as it captures every trade, regardless of the size of the transaction. However, tick volume alone does not provide information about the volume of shares traded.
- Contract Volume: Contract volume is used for instruments traded on exchanges, such as futures, options, and derivatives. It measures the total number of contracts or options traded during a specified period. Contract volume provides a clear picture of the trading activity in these derivative instruments.
Volume is typically displayed on stock charts as vertical bars positioned below the price chart. The height of each bar represents the volume traded during a specific time period, while the width of the bar represents the duration of that period. Traders can easily visualize and analyze volume patterns using these bar charts.
In addition to the basic volume data, traders can also access advanced volume indicators and tools that provide further insights into trading activity. These include on-balance volume (OBV), volume-weighted average price (VWAP), and volume-based oscillators.
It is important to note that volume data can vary across different financial platforms and data providers. While the absolute value of volume may differ, the relative volume patterns and trends remain consistent. Therefore, it is advisable to use volume analysis in comparison to historical data and relative to the stock’s average volume.
Now that we understand how volume is measured in stocks, let’s move on to the next section and explore how to interpret volume patterns to make more informed trading decisions.
Interpreting Volume Patterns in Stocks
Interpreting volume patterns in stocks is an essential skill for traders, as it provides valuable insights into market dynamics and can help identify potential trading opportunities. By analyzing volume patterns in conjunction with price movements, traders gain a deeper understanding of market sentiment and the strength of price trends. Here are some common volume patterns and how to interpret them:
- Increasing Volume in an Uptrend: When prices are rising and accompanied by increasing volume, it suggests strong buying interest and confirms the bullish trend. Higher volume indicates that more traders are participating in the market, which provides validation to the upward move.
- Decreasing Volume in an Uptrend: If prices are rising but volume is gradually decreasing, it can be a warning sign of weakness in the bullish trend. Lower volume indicates diminishing buying interest and may indicate that the uptrend is losing momentum.
- Increasing Volume in a Downtrend: In a downtrend, if prices are falling and there is an increase in volume, it indicates strong selling pressure and validates the bearish trend. Higher volume suggests that more traders are actively selling, adding to the downward momentum.
- Decreasing Volume in a Downtrend: When prices are falling but volume is decreasing, it may signal a potential reversal or consolidation. Lower volume indicates reduced selling interest and may suggest that the selling pressure is diminishing, potentially leading to a slowdown in the downtrend.
- Volume Spikes: Sudden spikes in volume indicate a significant increase in trading activity. These spikes can be triggered by news events, earnings releases, or other market catalysts. Volume spikes often imply a change in market sentiment and can lead to increased price volatility.
- Divergence with Price: Divergence occurs when there is a disconnect between price and volume. For example, if prices are rising but volume is decreasing, or if prices are falling but volume is increasing, it may indicate a potential reversal in the price trend. Divergence can provide early signals of a change in market direction.
It’s essential to analyze volume patterns in conjunction with other technical indicators and price analysis to validate trading signals. For example, if a stock breaks out of a major resistance level on high volume, it provides additional confirmation of the breakout and strengthens the bullish signal.
Traders should also compare current volume patterns with historical volume data to understand the relative strength of the current market activity. This helps in identifying abnormal trading volumes and potential market anomalies.
By consistently monitoring and interpreting volume patterns, traders can gain insights into market dynamics, identify potential trend reversals, and make more informed trading decisions.
Now let’s explore some volume analysis strategies that can aid traders in their stock trading endeavors.
Volume Analysis Strategies in Stock Trading
Volume analysis is a powerful tool that can be utilized in various strategies to enhance stock trading decisions. By analyzing volume patterns and combining them with other technical indicators, traders can gain valuable insights into market sentiment and identify potential trading opportunities. Here are some popular volume analysis strategies used in stock trading:
- Volume Confirmation: This strategy involves using volume to confirm the validity of price movements. For example, if prices are breaking out of a key resistance level, traders may look for a surge in volume to confirm the strength of the breakout. Conversely, if prices are declining and volume remains low, it could suggest a lack of conviction in the downtrend.
- Volume Breakout: This strategy focuses on identifying stocks with exceptionally high volume compared to their average volume. Traders look for stocks that are breaking out of significant price levels or forming chart patterns, such as triangles or flags, on high volume. The idea is that strong volume can potentially indicate a sustainable price breakout or trend continuation.
- Volume Climax: A volume climax occurs when there is an exceptionally high volume spike, often accompanied by a significant price move. Traders monitor volume climaxes to identify potential short-term exhaustion or reversal points. If prices surge on high volume, it may indicate buying climax, suggesting a potential reversal or temporary pause in the uptrend.
- Volume Divergence: This strategy involves analyzing the relationship between price and volume. If prices are rising, but volume is decreasing or stagnating, it may signal a bearish divergence and weakness in the uptrend. Conversely, if prices are falling, but volume is declining at a slower pace, it may indicate a bullish divergence and potential reversal in the downtrend.
- Volume Oscillators: Volume-based oscillators, such as the Volume Weighted Moving Average (VWMA) or the Chaikin Money Flow (CMF), are technical indicators that combine price and volume data. These oscillators measure the buying and selling pressure based on volume and can help traders identify overbought or oversold conditions in the market.
It’s important to note that volume analysis strategies are typically used in combination with other technical indicators and price analysis techniques. Traders should also consider fundamental analysis and market conditions before making trading decisions.
By incorporating volume analysis into their trading strategies, traders can gain an edge in the market by identifying potential opportunities with strong confirmation and improving the timing of their trades.
Next, let’s discuss the limitations of volume analysis in stock trading.
Limitations of Volume Analysis in Stocks
While volume analysis is a valuable tool for stock traders, it is important to recognize its limitations. While volume can provide important insights into market dynamics, it is not a standalone indicator and should be used in conjunction with other technical and fundamental analysis. Here are some limitations to consider when using volume analysis in stock trading:
- Volume does not indicate the direction of price: Volume alone cannot predict the direction of price movements. While high volume during an uptrend suggests bullish sentiment, it does not guarantee that prices will continue to rise. Traders should consider other technical indicators and factors to assess the overall market condition.
- Volume can be misleading in illiquid stocks: In stocks with low liquidity, volume can be highly variable and easily manipulated. A few large trades can significantly impact the volume, creating misleading signals. It is important to consider the liquidity of the stock when interpreting volume patterns.
- Volume analysis does not account for fundamental factors: Volume analysis focuses solely on trading activity and does not take into account fundamental factors such as company financials, industry trends, or macroeconomic events. Fundamental analysis is essential to gain a complete understanding of a stock’s potential.
- Volume patterns can be subjective: Interpreting volume patterns can be subjective, as traders may have different perspectives on what constitutes high or low volume. There is no fixed threshold for determining when volume is significant, and different traders may emphasize different aspects of volume analysis.
- Volume patterns may not always repeat: While historical volume patterns can provide insights into future market behavior, they do not guarantee that similar patterns will occur in the future. Market conditions and investor sentiment can change, leading to different volume patterns in similar situations.
- Volume analysis cannot predict market tops or bottoms: While volume analysis can provide signals of potential reversals or changes in market sentiment, it cannot accurately predict market tops or bottoms. Traders should exercise caution and consider other factors when attempting to time the market based on volume analysis.
Despite these limitations, volume analysis remains a valuable tool when used in conjunction with other indicators and analysis techniques. By considering these limitations and understanding the nuances of volume analysis, traders can make more informed decisions and improve their overall trading strategy.
Finally, let’s summarize the key points we have discussed throughout the article.
Conclusion
Volume analysis plays a crucial role in stock trading, providing valuable insights into market dynamics, trends, and investor sentiment. By understanding and interpreting volume patterns, traders can gain a deeper understanding of market behavior and make more informed trading decisions.
In this article, we explored the definition of volume in stocks and its importance in stock trading. We discussed the factors that can influence volume and how it is measured in the financial markets. We also examined various volume analysis strategies, including volume confirmation, breakouts, climaxes, divergence, and the use of volume-based oscillators.
While volume analysis has its limitations, such as its inability to predict price direction or account for fundamental factors, it remains a valuable tool when used in conjunction with other technical and fundamental analysis techniques.
To effectively utilize volume analysis, traders should combine it with other indicators, consider market conditions, and conduct thorough research to ensure a well-rounded trading strategy. Remember to analyze volume patterns in relation to historical data, as well as relative to the stock’s average trading volume.
By incorporating volume analysis into your stock trading approach, you can gain a competitive edge and improve your ability to identify potential trading opportunities, confirm price movements, and enhance the precision of your trading decisions.
As with any trading strategy, it is important to continuously refine and adapt your approach based on market conditions and your own trading experience. Keep learning, practicing, and refining your skills to become a successful trader.
Now that you have a comprehensive understanding of volume in stocks and its significance in trading, go ahead and apply this knowledge to your own trading journey. Best of luck!
What's Hot
Latest Articles
Related Post

By: • Finance
By: • Finance

By: • Finance

By: • Finance

By: • Finance

By: • Finance
By: • Finance

By: • Finance

By: • Finance
By: • Finance

By: • Finance

By: • Finance

By: • Finance

By: • Finance

By: • Finance