Home>Finance>Point-and-Figure (P&F) Chart: Definition And How To Use In Trade
Finance
Point-and-Figure (P&F) Chart: Definition And How To Use In Trade
Published: January 8, 2024
Learn what a Point-and-Figure (P&F) Chart is, how it can be used in trade, and its benefits in the world of finance.
(Many of the links in this article redirect to a specific reviewed product. Your purchase of these products through affiliate links helps to generate commission for LiveWell, at no extra cost. Learn more)
Point-and-Figure (P&F) Chart: Definition and How to Use in Trade
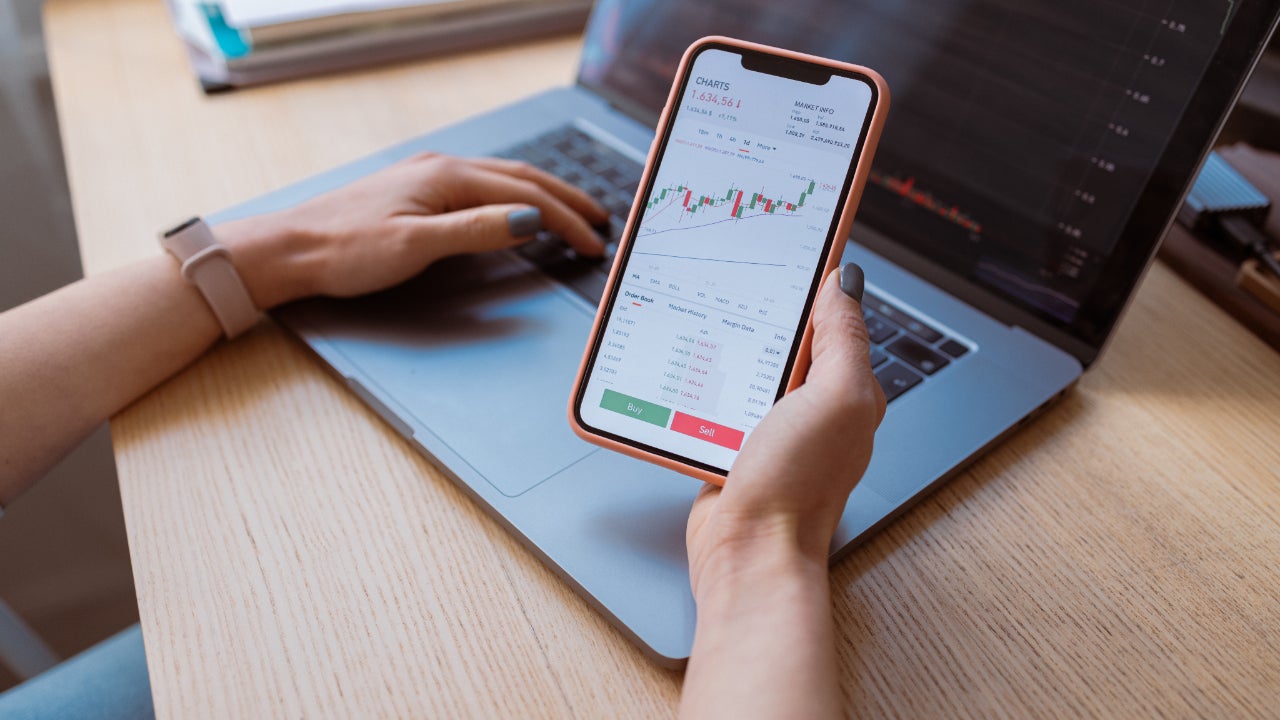
Welcome to the FINANCE category of our blog, where we offer valuable insights and tips to help you navigate the world of personal finance. In today’s post, we’ll dive into the fascinating topic of Point-and-Figure (P&F) charts. Whether you’re a trader, investor, or simply curious about financial markets, understanding P&F charts can be a valuable tool in your arsenal. So, let’s explore what P&F charts are, how they work, and how you can use them in your own trading strategy.
Key Takeaways:
- P&F charts are a type of technical analysis tool used by traders to identify trends and potential price targets.
- Unlike traditional candlestick or bar charts, P&F charts focus solely on price movements and filter out insignificant price fluctuations.
What are Point-and-Figure (P&F) Charts?
P&F charts trace their origins back to the late 19th century and were initially used to track price movements in the stock market. These charts gained popularity due to their simplicity and ability to filter out market noise, making it easier for traders to identify significant price trends. P&F charts focus solely on price movements and do not consider time or volume, making them unique compared to other charting methods.
How Do P&F Charts Work?
The methodology behind P&F charts is quite straightforward. Instead of using traditional time-based intervals, P&F charts use box sizes to represent price movements. A box is drawn on the chart for every specified price increment, typically using X’s for rising prices and O’s for falling prices.
When a price reaches a specific threshold, a new column is created. Each column represents a specific price level, allowing traders to easily identify trends. The charts eliminate minor price fluctuations, focusing only on significant market movements.
Using P&F Charts in Trade
Now that we understand the basics, let’s explore how you can use P&F charts in your own trading strategy. Here are some key points to consider:
- Identifying Price Trends: P&F charts make it easier for traders to identify price trends, as they filter out noise and focus solely on significant price movements. By analyzing the columns and patterns on the chart, you can identify support and resistance levels, trend reversals, and potential entry or exit points for trades.
- Setting Price Targets: P&F charts can also help you set price targets for your trades. By analyzing the vertical columns on the chart, you can calculate the potential price move based on the pattern or formation you’re observing. This information can be useful for determining when to take profit or adjust stop-loss levels.
When using P&F charts, it’s important to combine them with other technical analysis tools and indicators to validate your trade decisions. Remember, no single charting method can guarantee successful trades, but incorporating P&F charts into your analysis can provide valuable insights.
So, there you have it! Now you’re equipped with a basic understanding of Point-and-Figure (P&F) charts and how to use them in your own trading strategy. Feel free to experiment with different chart settings and analyze historical data to get a better grasp of this powerful tool. Happy trading!
What's Hot
Latest Articles
Related Post
By: • Finance
By: • Finance


By: • Finance
By: • Finance

By: • Finance


By: • Finance
By: • Finance

By: • Finance

By: • Finance