Finance
What Does Red And Green Mean In Stocks
Published: January 17, 2024
Discover the meaning of red and green in stocks and how they impact your financial portfolio. Gain insights into finance strategies and stock market trends.
(Many of the links in this article redirect to a specific reviewed product. Your purchase of these products through affiliate links helps to generate commission for LiveWell, at no extra cost. Learn more)
Table of Contents
Introduction
When it comes to investing in stocks, every investor wants to know what the colors red and green signify. These colors are commonly used to represent positive or negative movements in stock prices. In this article, we will delve into the meaning behind red and green in stocks and how understanding these colors can help investors make informed decisions.
Stock prices are constantly fluctuating, and understanding these fluctuations is crucial for investors. The colors red and green play a significant role in tracking these price movements, as they indicate whether a stock’s price has increased or decreased compared to the previous trading day.
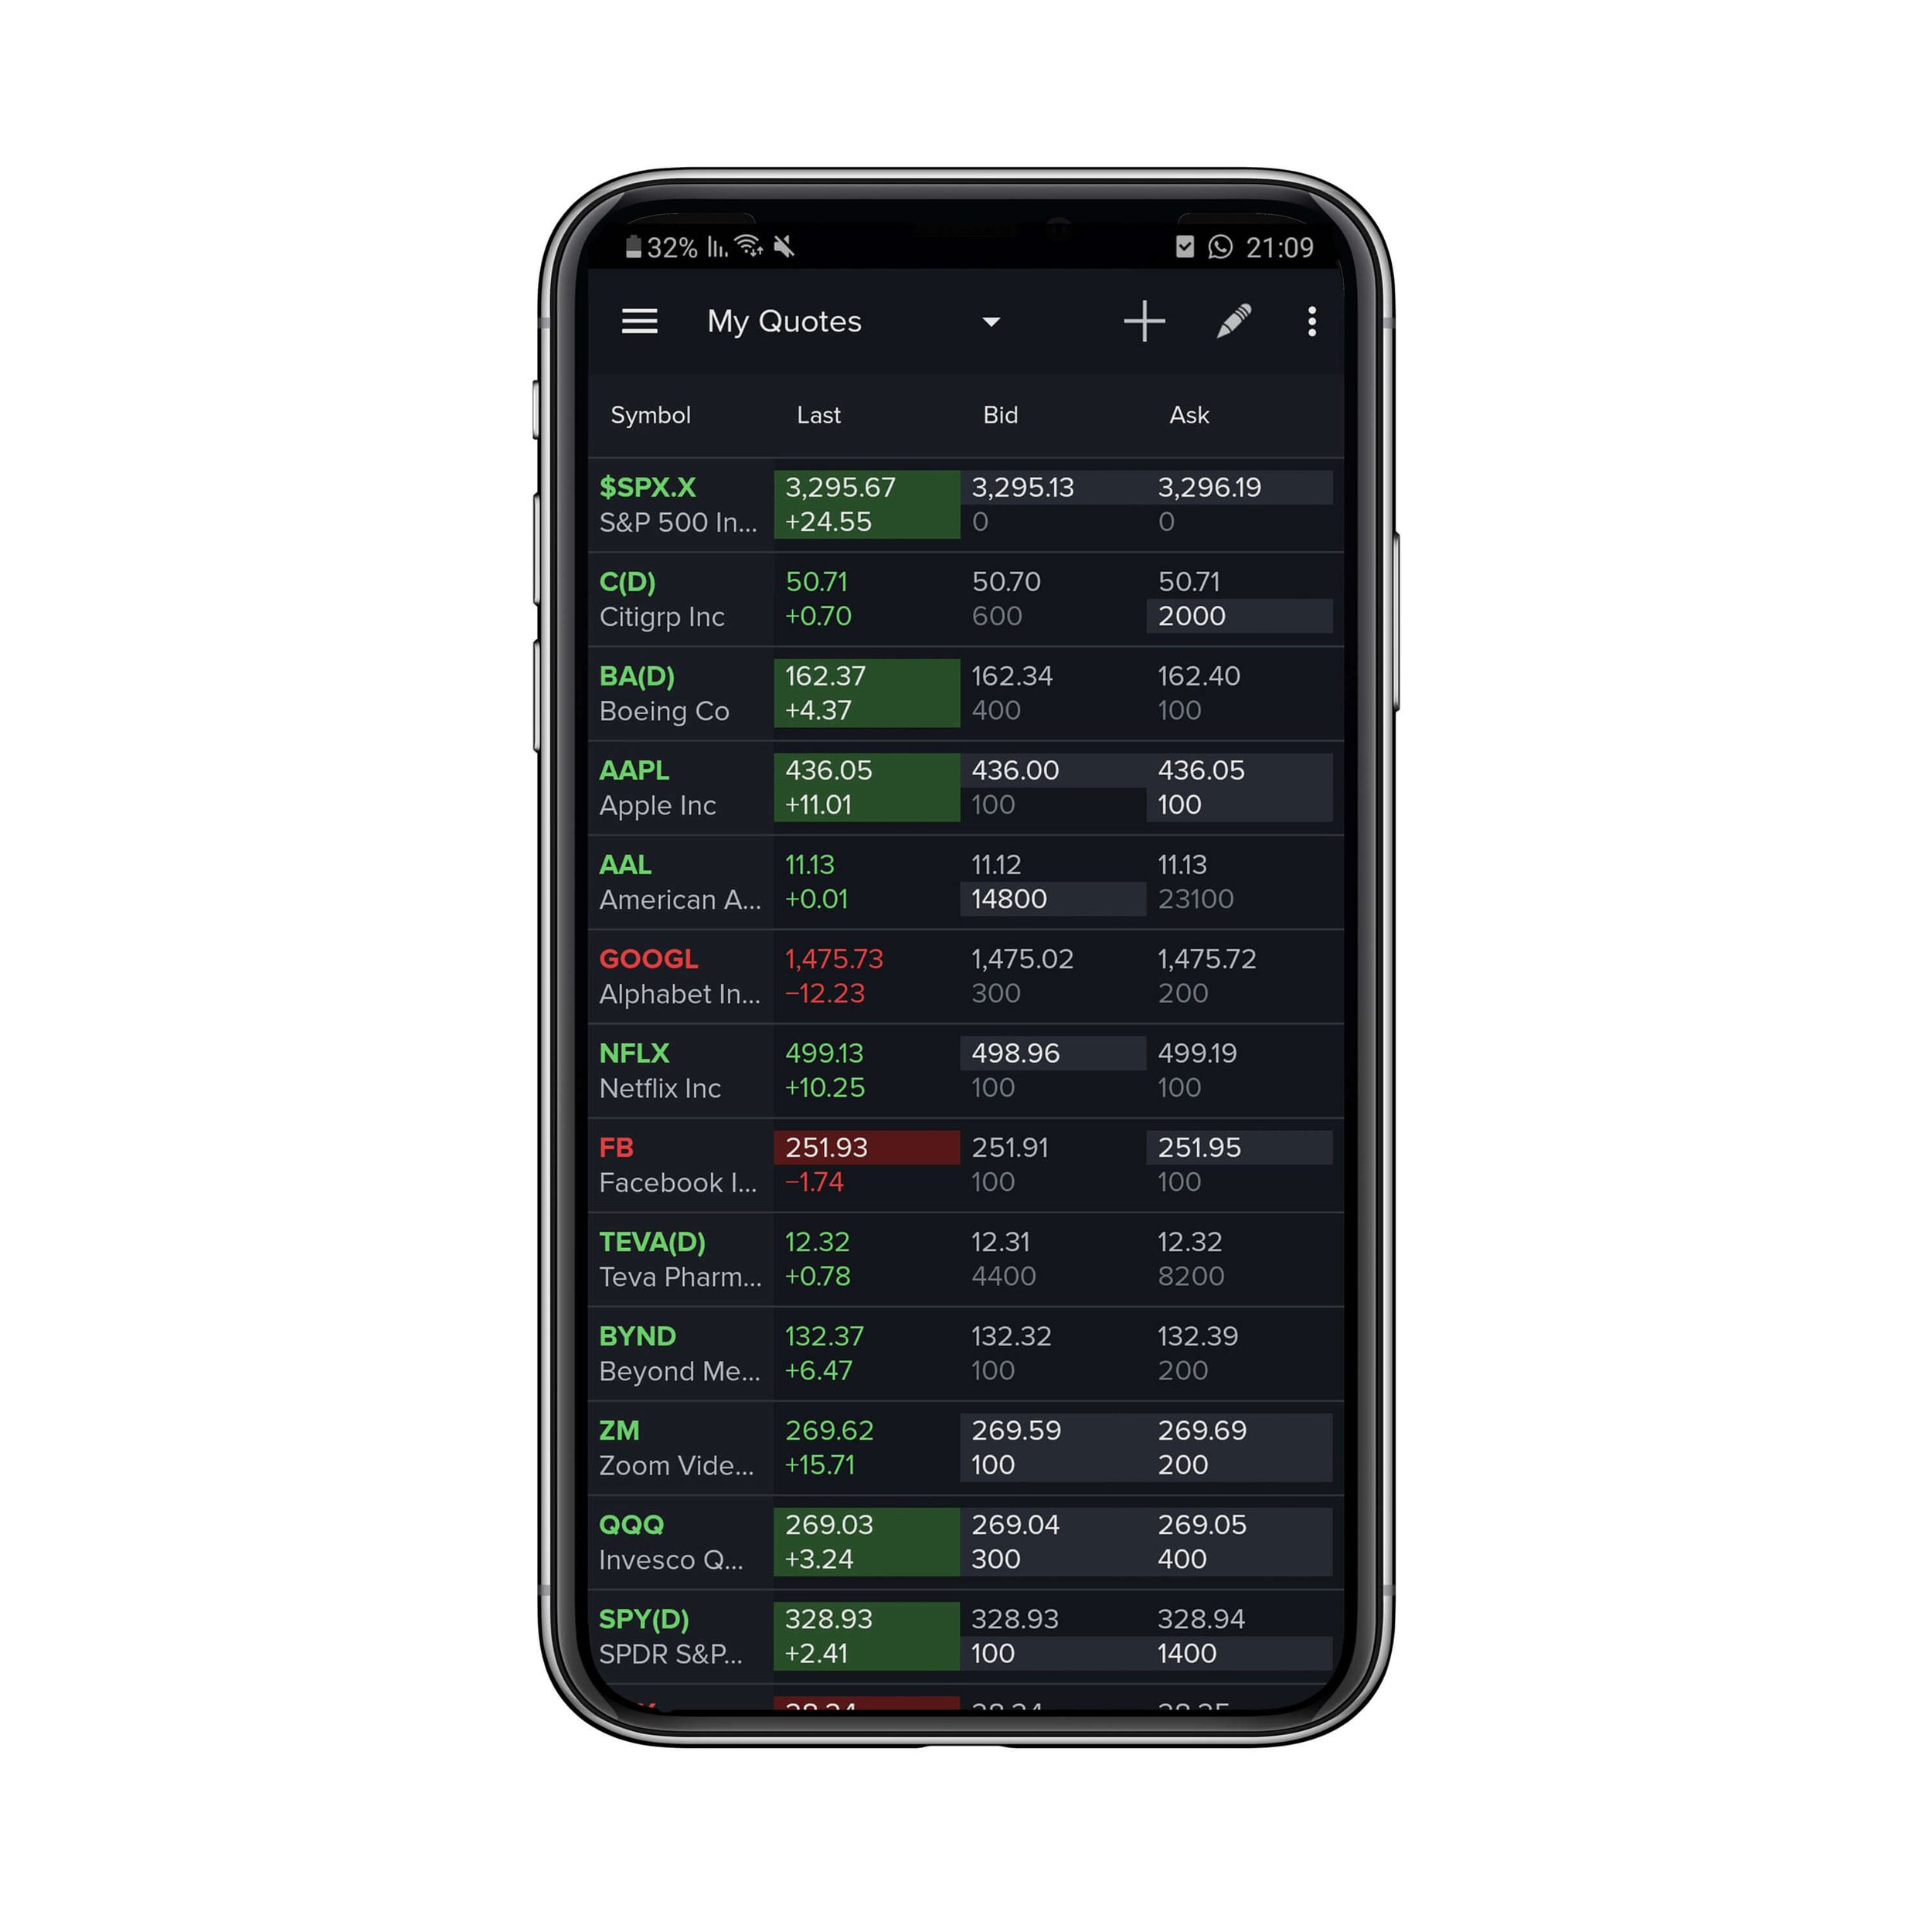
So, what exactly do red and green signify in stock trading? In simple terms, red typically represents a downward movement in stock prices, indicating a decrease in value, while green signifies an upward movement, indicating an increase in value. These colors act as visual cues that help investors quickly assess the current market sentiment.
It’s important to note that there are other factors besides color that investors consider when analyzing stock performance, such as volume, news releases, and overall market trends. However, the colors red and green are widely recognized and serve as a quick indicator of stock price movements.
In the following sections, we will discuss the implications of red and green in more detail, including the potential reasons for these movements and how investors can interpret them to make informed investment decisions.
Definition of Red and Green in Stocks
In the world of stock trading, the colors red and green have specific meanings that represent the movement of stock prices. These colors are often used in stock charts, trading platforms, and financial news to visually convey the performance of stocks.
When a stock’s price decreases compared to the previous trading day, it is typically represented by the color red. This downward movement signifies a decline in value and can indicate that investors are selling off their shares, leading to a decrease in demand and, consequently, a fall in price.
Conversely, when a stock’s price increases compared to the previous trading day, it is usually represented by the color green. This upward movement signifies an increase in value and can indicate that investors are buying shares, driving up demand and, consequently, pushing the price higher.
The use of red and green symbols in stock trading serves a practical purpose by providing a clear visual representation of the market sentiment. Investors can quickly assess whether a stock has gained or lost value by simply glancing at the color on a chart or trading platform.
It’s worth noting that the use of red and green for representing stock movements is largely standardized across different financial platforms and regions. However, there may be variations in color coding among different platforms, such as the use of different shades of red or green.
While red and green are the most commonly used colors to represent downward and upward movements in stocks, it’s important to remember that they are just visual cues. It’s necessary to consider other fundamental and technical factors when making investment decisions.
In the following sections, we will explore the factors that influence red and green movements in stocks and discuss how investors can interpret these trends to their advantage.
Red in Stocks
When the color red is associated with a stock, it typically indicates a downward movement in the stock’s price. This downward movement signifies a decrease in value and can be a result of several factors in the financial market.
One common reason for a stock to turn red is negative market sentiment. Poor economic news, geopolitical tensions, or industry-specific issues can lead to a decline in investor confidence and subsequent selling pressure on a stock. This selling pressure can drive prices downward, causing the stock to appear red on trading platforms and stock charts.
Red can also indicate a correction or a bearish trend in the overall market. After a prolonged period of growth, stock prices may reach a point where they are considered overvalued. This triggers profit-taking activities among investors, causing the prices to pull back and turn red.
Another reason for stocks turning red is company-specific factors. Poor financial performance, such as disappointing earnings reports or high debt levels, can lead to a loss in investor confidence, resulting in a decline in the stock price.
It’s important to note that not all red movements indicate a negative outlook for a stock. In some cases, short-term price declines can be seen as buying opportunities for investors looking to enter a position at a more favorable price. Therefore, it’s crucial to analyze the reasons behind the red movement and consider other fundamental and technical factors before making any investment decisions.
While the color red can signify a downward movement and potential risks in stock trading, it should not be solely relied upon for investment decisions. Using red as a guide, along with comprehensive research and analysis, can help investors navigate the dynamic and ever-changing world of the stock market.
Green in Stocks
When a stock is represented by the color green, it typically signifies an upward movement in the stock’s price. This upward movement indicates an increase in value and can be attributed to various factors in the financial market.
One primary reason for a stock to turn green is positive market sentiment. Favorable economic news, strong corporate earnings, or positive industry trends can boost investor confidence and lead to increased buying activity. This increased demand can drive the stock price higher, causing it to appear green on trading platforms and stock charts.
Green can also indicate a market rally or a bullish trend in the overall market. In such cases, multiple stocks across different industries may experience upward movements as optimism and buying activity dominate the market. This can be a result of positive economic indicators, favorable government policies, or an overall positive outlook for specific sectors.
In addition, specific company-related news or events can trigger a green movement for a stock. For example, the announcement of a new product, a lucrative business deal, or positive earnings surprises can drive investor enthusiasm and push the stock’s price higher.
Investors often view green movements in stocks as a sign of growth and potential opportunities. However, it is important to conduct thorough research and analysis before making any investment decisions based solely on the color green. It’s essential to assess the fundamentals of the company, consider valuation metrics, and evaluate technical indicators to ensure informed decision-making.
While green movements often indicate positive trends in stock prices, it is crucial to remain cautious and understand that market dynamics can change rapidly. Proper risk management and diversification strategies should always be employed to mitigate potential losses and maximize potential gains in the stock market.
By keeping a close eye on green movements and understanding the factors driving them, investors can make informed decisions and take advantage of potential profit opportunities.
Factors Influencing Red and Green Movements
The colors red and green in stocks are influenced by a variety of factors that shape market sentiment and drive price movements. Understanding these factors can help investors better interpret the significance of red and green movements and make informed investment decisions.
1. Economic Factors: Economic indicators, such as GDP growth, inflation rates, and interest rates, can significantly impact stock prices. Positive economic data, like strong job growth or increased consumer spending, can contribute to green movements as investors gain confidence in the market. On the other hand, negative economic news may lead to red movements as investors anticipate potential challenges ahead.
2. Company Performance: The financial performance of a company, including earnings reports, revenue growth, and profit margins, can heavily influence stock movements. Strong financial results often lead to green movements, as investors become more optimistic about the company’s prospects. Conversely, poor performance can trigger red movements as investors worry about the company’s ability to generate returns.
3. Industry Trends: Industry-specific factors also play a role in stock movements. Positive news, innovative products, or emerging markets within an industry can lead to green movements across related stocks. Conversely, negative developments, fierce competition, or regulatory challenges may result in red movements.
4. Investor Sentiment: The collective sentiment and behavior of investors can contribute to both red and green movements. Fear and uncertainty in the market can drive selling pressure and red movements, while positive sentiment and optimism can lead to increased buying activity and green movements.
5. News and Events: Market-moving news or significant events, such as mergers and acquisitions, regulatory changes, or geopolitical developments, can trigger sharp red or green movements. Investors closely monitor news and events for potential opportunities or risks that may impact stock prices.
It’s important to note that the influence of these factors can vary in magnitude and timing. The stock market is complex and dynamic, and multiple factors often interact to shape price movements. Therefore, it’s crucial for investors to stay informed, conduct thorough research, and consider a range of factors when analyzing red and green movements in stocks.
By understanding the broad range of factors influencing stock movements, investors can make more informed decisions and navigate the market with greater confidence.
Interpretation of Red and Green Trends
Interpreting the trends represented by the colors red and green in stock trading is crucial for investors to make informed decisions. While red typically represents a downward movement and green signifies an upward movement, it’s important to consider several factors to accurately interpret these trends.
1. Timing and Context: Understanding the timeframe and context of the red or green trend is essential. Short-term fluctuations may not necessarily indicate a long-term trend. Analyzing the trend over a longer period and considering the broader market conditions can provide a more comprehensive interpretation.
2. Volume: Examining the trading volume associated with the red or green trend can provide valuable insights. High trading volume during a green trend suggests strong investor interest and support for the stock’s upward movement. Conversely, high volume during a red trend may indicate heightened selling pressure and potential weakness in the stock.
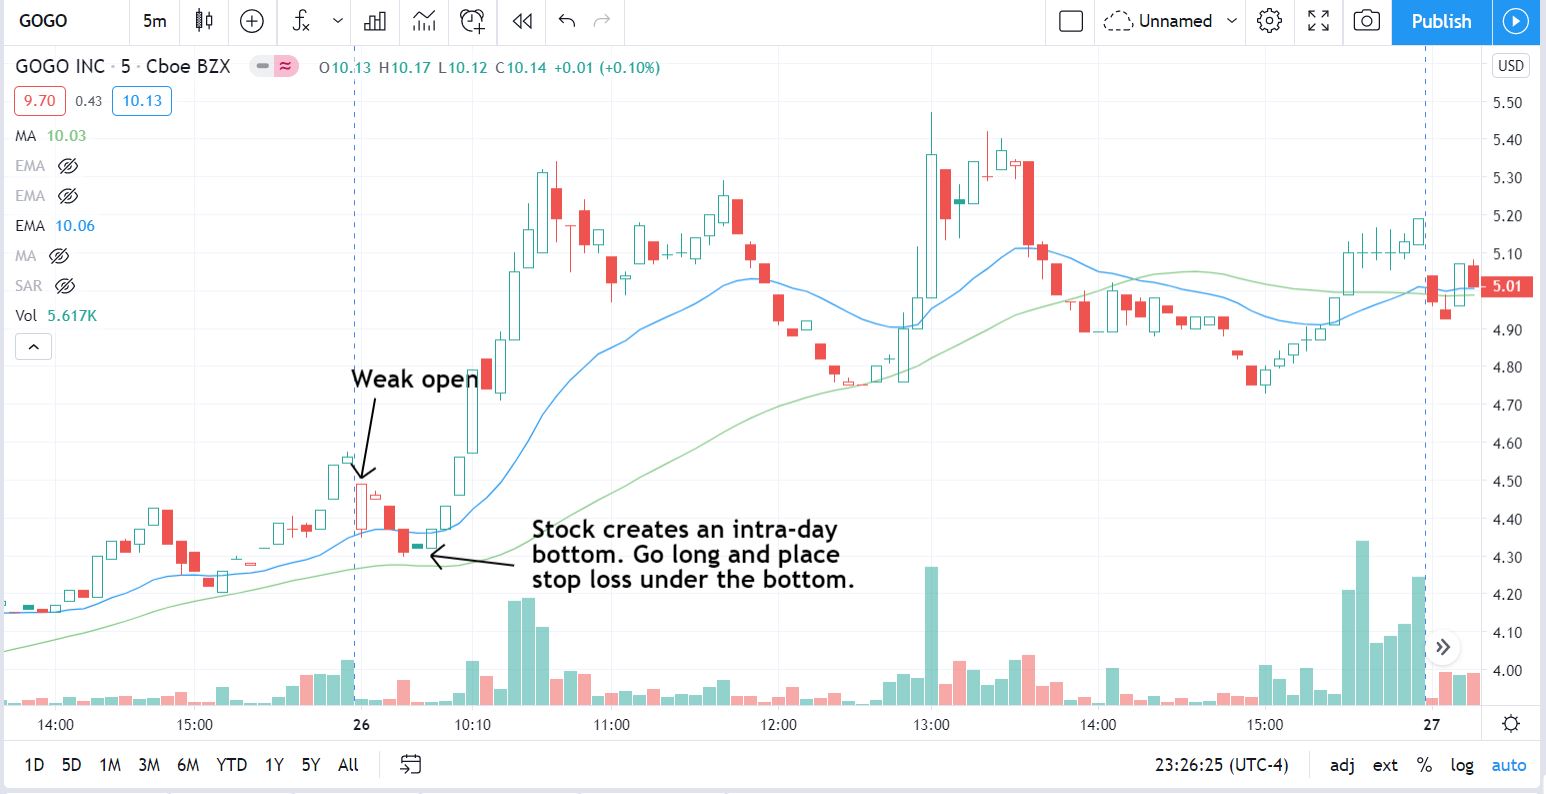
3. Support and Resistance Levels: Identifying support and resistance levels can assist in interpreting red and green trends. If a stock consistently bounces off a certain price level during a red trend, it may indicate a potential bottom and a possible reversal. Similarly, if a stock repeatedly struggles to break through a certain price level during a green trend, it may suggest a temporary ceiling and a potential pullback.
4. Fundamental Analysis: Conducting fundamental analysis is essential when interpreting red and green trends. Understanding the financial health of the company, industry trends, and market conditions can provide a more comprehensive perspective. Positive fundamentals combined with green trends may indicate a solid investment opportunity, while negative fundamentals and red trends may signal potential risks.
5. Technical Indicators: Utilizing technical indicators, such as moving averages, relative strength index (RSI), and trend lines, can aid in interpreting red and green trends. These indicators provide visual cues and mathematical calculations that can help identify potential turning points, overbought or oversold conditions, and trend confirmations.
It’s important to approach the interpretation of red and green trends with a balanced mindset. Emotional reactions based solely on color can lead to irrational decisions. By combining objective analysis with an understanding of market dynamics and trends, investors can make better-informed decisions and position themselves for potential opportunities or risks.
Lastly, it’s important to remember that stock market trends are not always predictable. Prices can fluctuate due to various factors, including unforeseen events and market sentiment shifts. Therefore, prudent risk management strategies, such as diversification and setting appropriate stop-loss levels, should be utilized to protect investments.
In summary, interpreting red and green trends requires a comprehensive analysis involving timing, context, volume, support and resistance levels, fundamental analysis, and technical indicators. By considering these factors, investors can gain a deeper understanding of stock trends and make more informed decisions.
Conclusion
The colors red and green play a significant role in stock trading, symbolizing downward and upward movements in stock prices, respectively. While red represents a decrease in value and green signifies an increase, it’s crucial for investors to understand the factors influencing these trends and interpret them accurately.
Red and green movements in stocks are influenced by various factors, including economic conditions, company performance, industry trends, investor sentiment, and news events. These factors interact in complex ways, making it essential for investors to conduct thorough research and analysis to make informed decisions.
Interpreting red and green trends requires assessing timing, context, trading volume, support and resistance levels, fundamental analysis, and technical indicators. By considering these factors, investors can gain a deeper understanding of the stock market and make more informed decisions.
It’s important to approach red and green trends with a balanced mindset and avoid making impulsive decisions solely based on color. Emotional reactions can lead to irrational investment choices. Instead, investors should rely on comprehensive analysis and consider other fundamental and technical factors to develop a well-rounded investment strategy.
Ultimately, the colors red and green are visual cues that provide a quick snapshot of stock movements. However, investors should supplement this information with a thorough understanding of market dynamics, industry trends, and individual company performance to make informed investment decisions.
By staying informed, conducting thorough research, and remaining disciplined, investors can navigate the stock market with greater confidence and increase their chances of making successful investment choices.
In conclusion, while colors can be a helpful visual tool, it is essential to embrace a comprehensive approach to investing and consider a broad range of factors to achieve long-term financial goals.
What's Hot
Latest Articles
Related Post

By: • Finance

By: • Finance

By: • Finance

By: • Finance

By: • Finance
By: • Finance

By: • Finance

By: • Finance

By: • Finance

By: • Finance

By: • Finance

By: • Finance


By: • Finance

By: • Finance