Home>Finance>How To Create Income Statement, Balance Sheet, And Retained Earnings On Excel

Finance
How To Create Income Statement, Balance Sheet, And Retained Earnings On Excel
Published: March 2, 2024
Learn how to create professional financial statements in Excel with our step-by-step guide. Master the basics of finance and accounting today!
(Many of the links in this article redirect to a specific reviewed product. Your purchase of these products through affiliate links helps to generate commission for LiveWell, at no extra cost. Learn more)
Table of Contents
Introduction
Creating financial statements is a crucial aspect of managing the financial health of any business. Among the key financial statements, the income statement, balance sheet, and retained earnings statement play a pivotal role in providing insights into a company's performance and financial position. In this comprehensive guide, we will delve into the process of creating these essential financial statements using Microsoft Excel.
By leveraging the power of Excel, individuals and businesses can efficiently organize financial data, perform calculations, and present the information in a clear and professional manner. Whether you're a small business owner, an accounting professional, or a finance enthusiast, mastering the art of creating financial statements in Excel can significantly enhance your ability to analyze financial performance and make informed decisions.
Throughout this guide, we will explore the step-by-step process of setting up an income statement to calculate the net income, creating a balance sheet to showcase the company's assets, liabilities, and equity, and calculating the retained earnings to track the accumulation of profits over time. Additionally, we will cover the essential formatting techniques to ensure the financial statements are visually appealing and easy to interpret.
Understanding the intricacies of financial statements and being able to construct them in Excel empowers individuals to gain valuable insights into a company's financial standing, identify areas for improvement, and communicate financial information effectively to stakeholders, investors, and decision-makers. Whether you're evaluating the performance of your own business, preparing for investor meetings, or seeking to enhance your financial analysis skills, mastering the creation of these financial statements in Excel is a valuable skill set.
So, let's embark on this journey to unlock the power of Excel and learn how to create income statements, balance sheets, and retained earnings statements that are not only accurate and informative but also visually compelling and professional. Let's dive into the process of setting up the income statement in Excel, where we'll calculate the company's revenues and expenses to determine the net income.
Setting Up the Income Statement
Creating an income statement in Excel involves organizing and calculating the revenues and expenses incurred by a company during a specific period. This financial statement provides a comprehensive overview of the company’s profitability and is essential for assessing its financial performance.
To begin, open a new Excel spreadsheet and label the first sheet as “Income Statement.” The income statement typically consists of several key components, including revenues, cost of goods sold, gross profit, operating expenses, and net income. Create a clear and organized layout for these components to ensure the information is presented in a logical manner.
Start by entering the company’s total revenues at the top of the income statement. This can include sales revenue, service revenue, and any other sources of income. Below the revenue section, calculate the cost of goods sold (COGS) to determine the direct costs associated with producing the goods or services sold by the company. Subtract the COGS from the total revenues to calculate the gross profit.
Next, list the operating expenses, such as salaries, rent, utilities, marketing expenses, and other overhead costs. These expenses are subtracted from the gross profit to arrive at the operating income. It’s important to categorize the expenses accurately to provide a clear breakdown of the company’s cost structure.
After deducting the operating expenses, the income statement should reflect the company’s operating income. Finally, factor in any non-operating income or expenses, such as interest income, interest expenses, and taxes, to calculate the net income. Ensure that the formulas used for these calculations are accurate and linked to the corresponding cells to facilitate automatic updates when changes are made to the underlying data.
Utilize Excel’s formatting tools to enhance the visual appeal of the income statement. Use bold fonts, borders, and shading to distinguish between different sections and make the information easier to interpret. Additionally, consider using charts and graphs to visually represent the revenue and expense components, providing a clear visualization of the company’s financial performance.
By following these steps and leveraging the capabilities of Excel, you can create a comprehensive income statement that accurately reflects the company’s financial performance. The income statement serves as a vital tool for assessing the profitability of the business and is essential for making informed financial decisions.
Creating the Balance Sheet
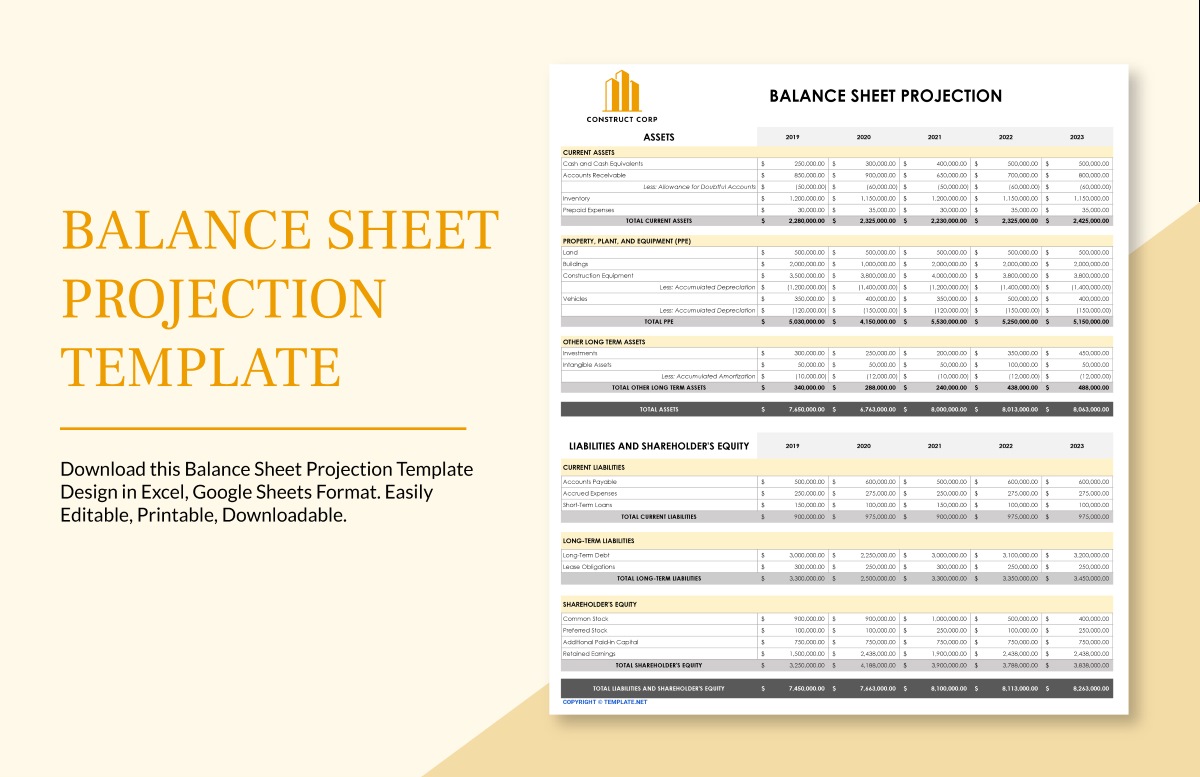
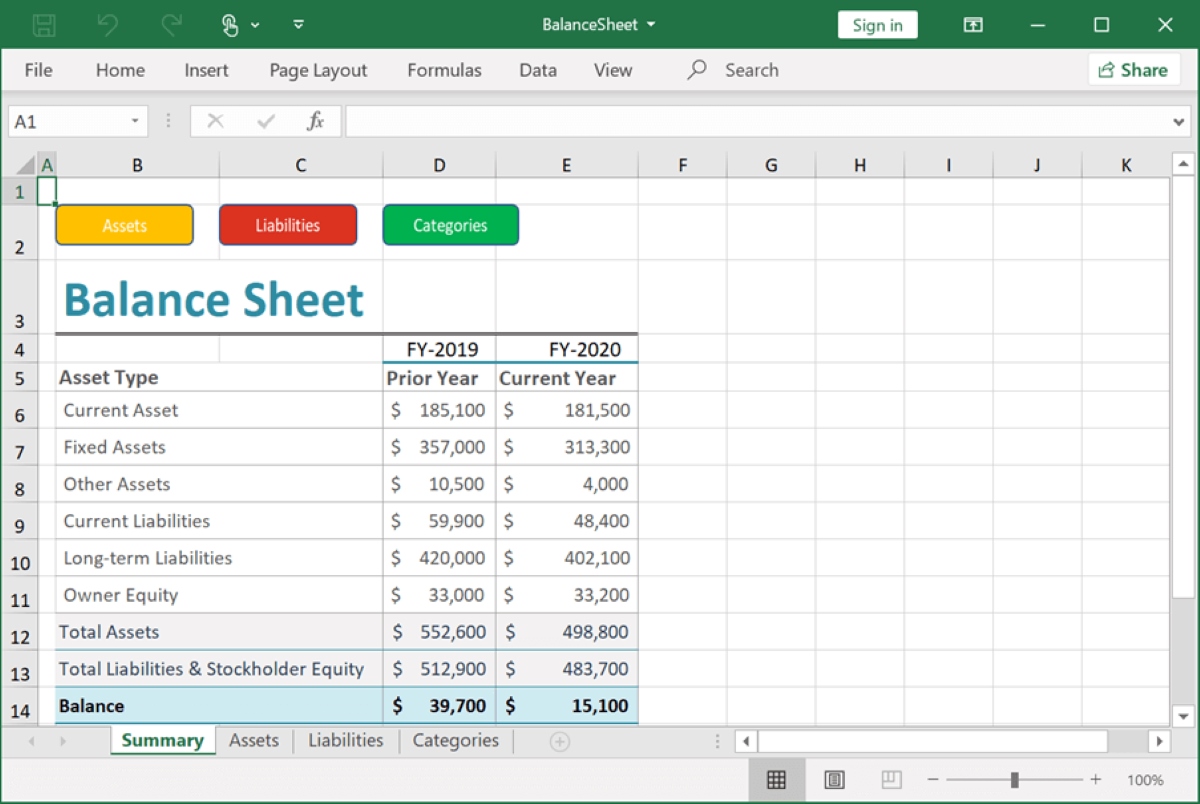
Constructing a balance sheet in Excel involves organizing the company’s assets, liabilities, and equity to provide a snapshot of its financial position at a specific point in time. The balance sheet is a fundamental financial statement that reflects the company’s resources, obligations, and ownership structure, offering valuable insights for stakeholders and investors.
To begin, open a new sheet in Excel and label it as “Balance Sheet.” The balance sheet is divided into two main sections: assets and liabilities & equity. Within the assets section, categorize the current assets, such as cash, accounts receivable, inventory, and short-term investments, as well as the non-current assets, including property, plant, equipment, and long-term investments.
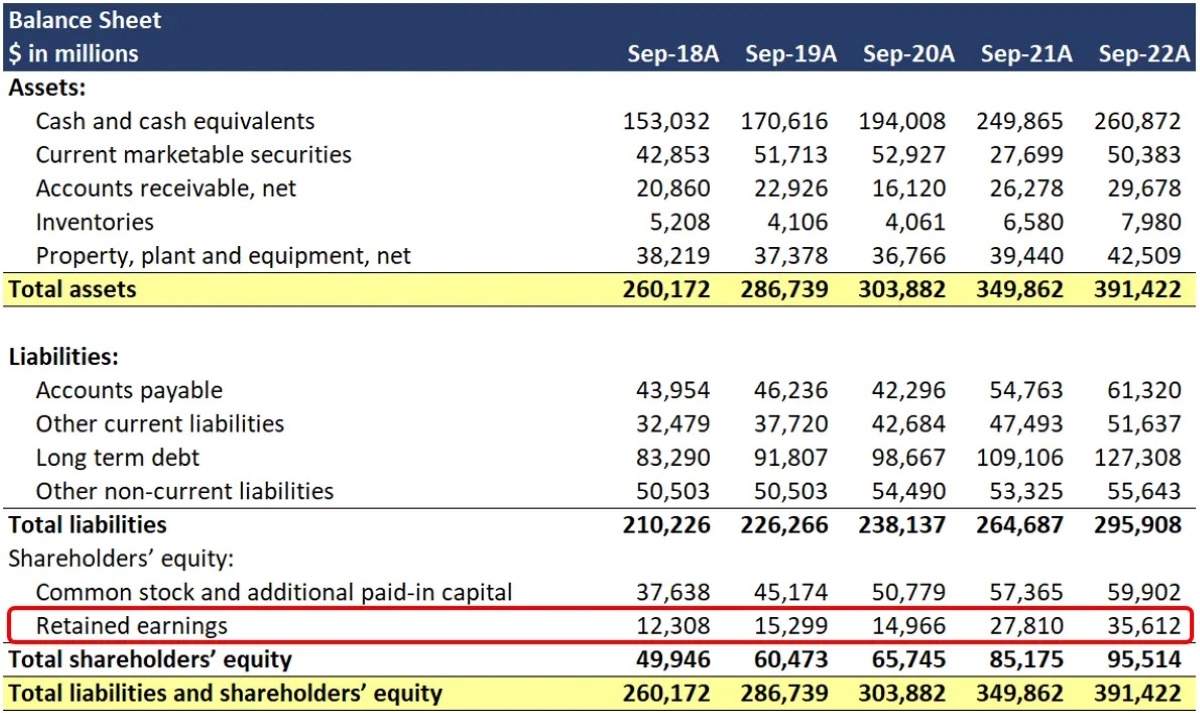
Organize the assets in a structured manner, ensuring that the total assets are calculated accurately at the bottom of the section. Moving on to the liabilities & equity section, list the current liabilities, such as accounts payable, short-term debt, and accrued expenses, followed by the non-current liabilities, including long-term debt and deferred tax liabilities.
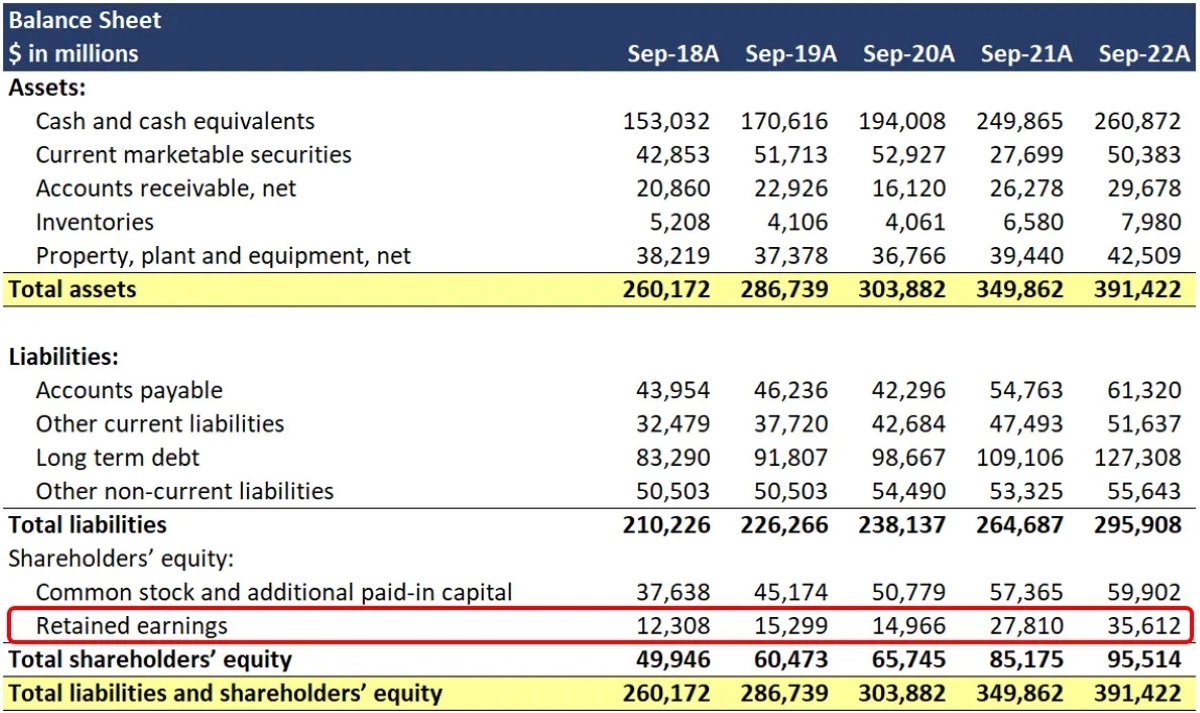
Finally, incorporate the equity section, encompassing the company’s common stock, additional paid-in capital, retained earnings, and any other equity components. The total liabilities and equity should be calculated at the bottom of this section to ensure the balance sheet adheres to the fundamental accounting equation: Assets = Liabilities + Equity.
Utilize Excel’s functions and formulas to calculate the totals for each section automatically. Link the cells containing the asset, liability, and equity values to the corresponding sections to enable seamless updates as the underlying data changes. Additionally, consider using conditional formatting to visually highlight the different sections and make the balance sheet easier to interpret.
Formatting the balance sheet effectively is crucial to ensuring clarity and professionalism. Use bold headers, borders, and shading to distinguish between the asset, liability, and equity sections. Consider incorporating visual elements, such as horizontal lines and alternating row colors, to enhance readability and organization.
By following these steps and leveraging Excel’s capabilities, you can create a comprehensive balance sheet that accurately portrays the company’s financial position. The balance sheet serves as a vital tool for evaluating the company’s liquidity, solvency, and overall financial health, providing stakeholders with essential information for decision-making and analysis.
Calculating Retained Earnings
Retained earnings represent the cumulative profits or losses of a company that have been retained for reinvestment into the business rather than distributed to shareholders as dividends. Calculating retained earnings in Excel involves tracking the net income or loss over time and adjusting for dividends to determine the accumulated retained earnings at a specific point in time.
To begin, open a new sheet in Excel and label it as “Retained Earnings Statement.” The calculation of retained earnings typically starts with the beginning retained earnings balance, which can be carried over from the previous accounting period or the company’s inception. If it’s the first accounting period, the beginning retained earnings balance is usually zero.
Next, incorporate the net income or loss for the current period. This value can be obtained from the income statement previously created in Excel. If the company incurred a net loss, the amount is subtracted from the beginning retained earnings balance. Conversely, if the company generated a net income, the amount is added to the beginning retained earnings balance.
Adjust for any dividends declared and paid during the period. Dividends represent the portion of profits distributed to shareholders and are subtracted from the calculated amount if dividends were paid out. The final result represents the ending retained earnings balance, which reflects the accumulated profits or losses retained by the company at the end of the period.
Utilize Excel’s formulas to automate the calculations and ensure accuracy. Link the relevant cells containing the beginning retained earnings balance, net income or loss, and dividends to the retained earnings statement to facilitate automatic updates as the underlying data changes. Consider using clear and descriptive labels for each component to enhance the readability of the retained earnings statement.
Formatting the retained earnings statement is essential to ensure clarity and coherence. Use bold headers, borders, and shading to delineate the different components of the statement. Consider incorporating visual elements, such as horizontal lines and alternating row colors, to improve the overall presentation and make the retained earnings statement visually appealing.
By following these steps and leveraging Excel’s functionalities, you can create a comprehensive retained earnings statement that accurately reflects the company’s accumulated profits or losses over time. The retained earnings statement provides valuable insights into the company’s reinvestment of earnings and is essential for assessing its long-term financial performance and stability.
Finalizing and Formatting the Financial Statements
Once the income statement, balance sheet, and retained earnings statement have been constructed in Excel, it’s essential to finalize and format these financial statements to ensure clarity, professionalism, and ease of interpretation. Effective formatting enhances the visual appeal of the financial statements and facilitates seamless communication of financial information to stakeholders and decision-makers.
Begin by reviewing each financial statement meticulously to verify the accuracy of the data and calculations. Check for any discrepancies or errors in the formulas and ensure that all the relevant financial data has been accurately incorporated into the statements. It’s crucial to maintain precision and attention to detail during this review process to guarantee the reliability of the financial information.
Next, consider the overall layout and organization of the financial statements. Ensure that the information is presented in a logical and coherent manner, with clear delineation between different sections and components. Use descriptive headers, subheadings, and labels to guide the reader through the financial statements and provide context for the presented data.
Utilize Excel’s formatting tools to enhance the visual appeal of the financial statements. Apply consistent formatting, such as bold fonts, borders, and shading, to distinguish between different sections and make the information easier to interpret. Consider using color coding to highlight specific data points or trends, providing visual cues for key insights within the financial statements.
Incorporate visual elements, such as charts and graphs, to supplement the numerical data presented in the financial statements. Visual representations can offer a clear and concise overview of the company’s financial performance, making it easier for stakeholders to grasp the key metrics and trends. Excel’s charting capabilities enable the creation of professional and visually compelling visualizations to complement the financial data.
Consider the overall readability and accessibility of the financial statements. Ensure that the font size and style are conducive to easy reading, and avoid cluttering the statements with excessive data or unnecessary details. Strive for a balance between comprehensive information and concise presentation to maintain the reader’s engagement.
By finalizing and formatting the financial statements effectively, you can create professional, visually compelling documents that effectively communicate the company’s financial performance and position. These polished financial statements serve as invaluable tools for decision-making, analysis, and communication, empowering stakeholders with the essential information they need to assess the company’s financial health and prospects.
Conclusion
In conclusion, mastering the creation of income statements, balance sheets, and retained earnings statements in Microsoft Excel is a valuable skill set for individuals and businesses alike. These financial statements serve as indispensable tools for assessing the financial performance, position, and stability of a company, providing vital insights for stakeholders, investors, and decision-makers.
By leveraging the power of Excel, individuals can efficiently organize financial data, perform calculations, and present information in a clear, professional, and visually appealing manner. The step-by-step process of setting up an income statement to calculate net income, creating a balance sheet to showcase the company’s assets, liabilities, and equity, and calculating retained earnings to track the accumulation of profits over time equips individuals with the ability to analyze financial performance and make informed decisions.
Effective formatting and finalization of the financial statements are crucial steps in ensuring the clarity, professionalism, and accessibility of the presented financial information. By reviewing the accuracy of the data, organizing the layout, applying consistent formatting, and incorporating visual elements, individuals can create polished financial statements that effectively communicate the company’s financial performance and position.
Ultimately, the ability to create comprehensive and visually compelling financial statements in Excel empowers individuals to gain valuable insights into a company’s financial standing, identify areas for improvement, and communicate financial information effectively to stakeholders, investors, and decision-makers. Whether evaluating the performance of a business, preparing for investor meetings, or seeking to enhance financial analysis skills, mastering the creation of these financial statements in Excel is a valuable skill set with far-reaching implications for informed decision-making and financial management.
As we conclude this guide, it’s evident that the process of creating income statements, balance sheets, and retained earnings statements in Excel goes beyond mere number crunching. It represents a powerful means of interpreting and communicating a company’s financial story, enabling individuals to navigate the complexities of financial data with confidence and proficiency.
What's Hot
Latest Articles
Related Post

By: • Finance

By: • Finance
By: • Finance


By: • Finance

By: • Finance
By: • Finance

By: • Finance

By: • Finance

By: • Finance

By: • Finance

By: • Finance

By: • Finance