Finance
How To Do A Profit And Loss Statement In Excel
Published: January 22, 2024
Learn how to create a comprehensive profit and loss statement in Excel with this step-by-step guide. Perfect for finance professionals and small business owners.
(Many of the links in this article redirect to a specific reviewed product. Your purchase of these products through affiliate links helps to generate commission for LiveWell, at no extra cost. Learn more)
Table of Contents
Introduction
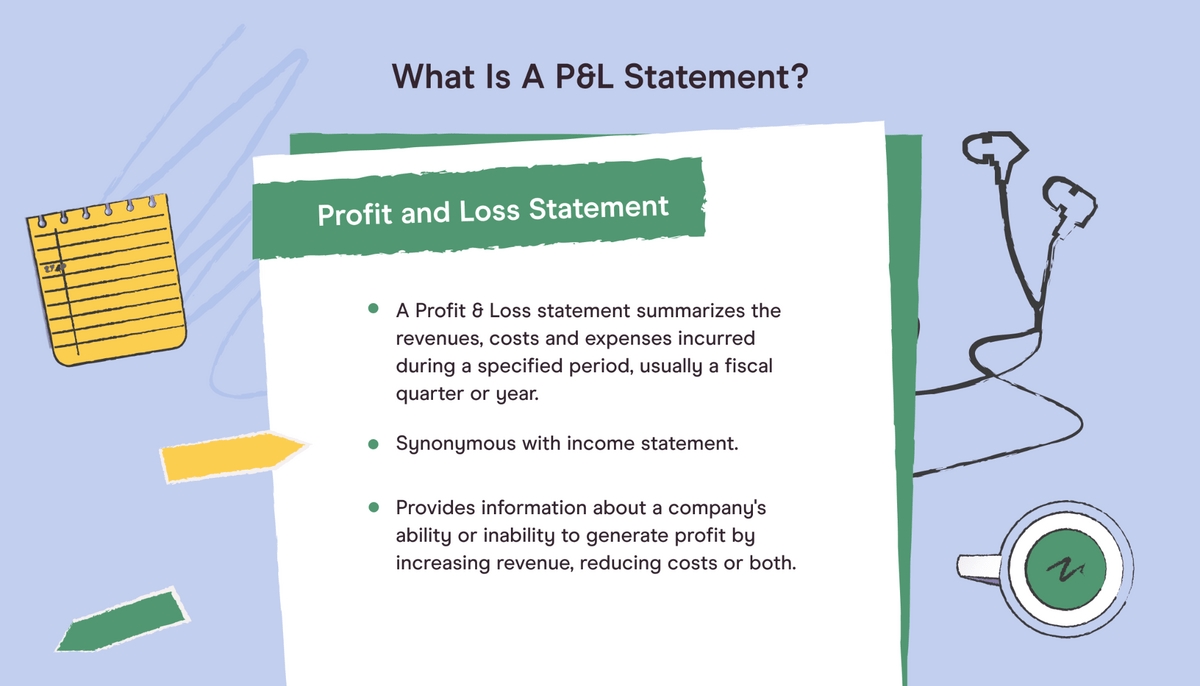
Creating a profit and loss statement in Excel is a fundamental skill for any business owner or financial professional. This financial document, also known as an income statement, provides a comprehensive overview of a company's revenues, costs, and expenses over a specific period. It serves as a vital tool for assessing the financial health and performance of a business, offering insights into its ability to generate profits and manage expenses effectively.
By leveraging Excel for this purpose, individuals can harness the power of spreadsheets to organize, calculate, and present financial data in a clear and structured format. Excel's versatile features enable users to perform complex calculations, create dynamic formulas, and customize the presentation of financial information, making it an ideal platform for generating profit and loss statements.
In this guide, we will explore the step-by-step process of creating a profit and loss statement in Excel, from setting up the spreadsheet to inputting revenue and expenses, calculating the final profit or loss figure, and formatting the statement for professional presentation. Whether you're a small business owner, an aspiring entrepreneur, or a finance professional, mastering this essential skill will empower you to make informed financial decisions and gain a deeper understanding of your organization's financial performance.
Let's dive into the world of Excel and unlock the potential to transform raw financial data into a meaningful and actionable profit and loss statement.
Setting Up Your Excel Spreadsheet
Before delving into the specifics of revenue and expenses, it’s crucial to set up your Excel spreadsheet in a clear and organized manner. This initial step lays the foundation for accurately capturing and analyzing financial data. Here’s how to set up your Excel spreadsheet for creating a profit and loss statement:
- Open a New Excel Workbook: Launch Excel and open a new workbook to begin the process. This provides a clean canvas for building your profit and loss statement.
- Create Relevant Headers: The first row of your spreadsheet should contain headers for the various components of the profit and loss statement, such as Revenue, Expenses, and Profit/Loss. This ensures that your data is properly categorized and easy to understand.
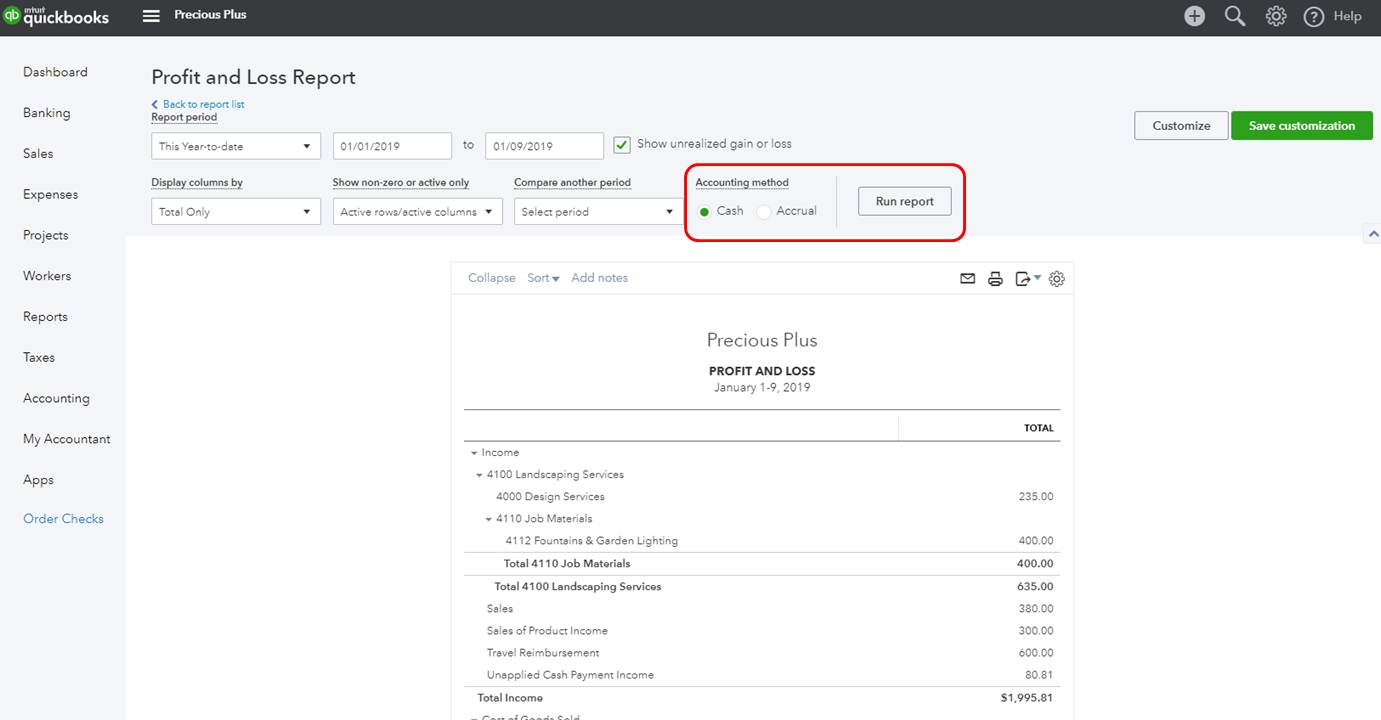
- Designate Time Period: Specify the time period covered by the profit and loss statement. Whether it’s monthly, quarterly, or annually, clearly indicate the duration to provide context for the financial data being presented.
- Format Cells for Currency and Numbers: Given that financial data typically involves currency and numerical values, it’s essential to format the relevant cells accordingly. This includes setting the appropriate number of decimal places and applying currency formatting to monetary figures.
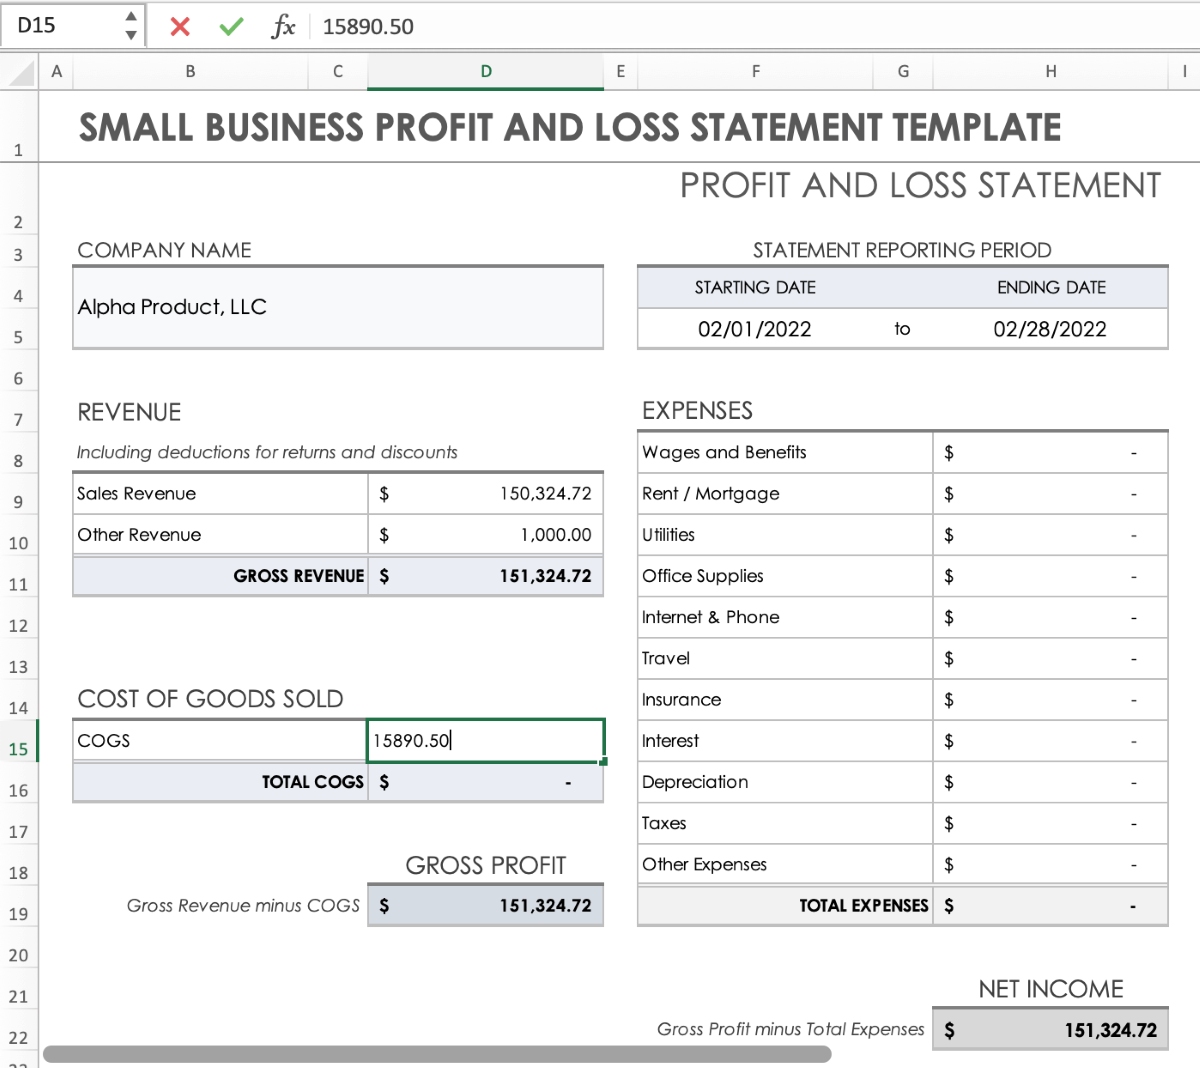
- Include Company Information: Consider incorporating essential company details, such as the business name, date of the statement, and any relevant identifiers. This adds a professional touch to the document and ensures that it is clearly associated with the correct business entity.
By following these steps, you can establish a well-structured and visually appealing Excel spreadsheet that serves as the canvas for constructing your profit and loss statement. This organized approach sets the stage for accurate data input and seamless calculations as you progress through the process.
Inputting Revenue
Revenue forms the cornerstone of a profit and loss statement, representing the income generated by a business through its primary operations. When inputting revenue data into your Excel spreadsheet, it’s essential to capture various sources of income accurately. Here’s a systematic approach to inputting revenue:
- Categorize Revenue Streams: Begin by categorizing the different streams of revenue, such as product sales, service revenue, interest income, or any other sources specific to your business. This segmentation allows for a comprehensive analysis of income sources.
- Create Dedicated Rows for Each Revenue Category: Allocate individual rows in your spreadsheet for each revenue category identified. This separation ensures that each source of income is distinctly represented and facilitates clear reporting.
- Input Actual Revenue Figures: Populate the designated cells with the actual revenue figures corresponding to each category. Ensure that the data entered is accurate and reflects the income earned within the specified time period.
- Include Descriptive Labels: Accompany the revenue figures with descriptive labels that provide context and clarity. For instance, if a particular revenue stream pertains to a specific product line or service offering, include a brief description to elucidate the source of income.
- Summarize Total Revenue: Dedicate a separate row or cell to calculate the total revenue by summing up the individual income streams. This consolidated figure serves as a key metric for assessing the overall income generated by the business.
By meticulously inputting revenue data in this manner, you can construct a comprehensive overview of the income generated by your business. This organized presentation of revenue streams sets the stage for accurate analysis and facilitates informed decision-making based on the financial performance of your enterprise.
Inputting Expenses
Expenses are a critical component of the profit and loss statement, representing the costs incurred in running a business. When inputting expense data into your Excel spreadsheet, it’s essential to capture and categorize various types of expenditures accurately. Here’s a systematic approach to inputting expenses:
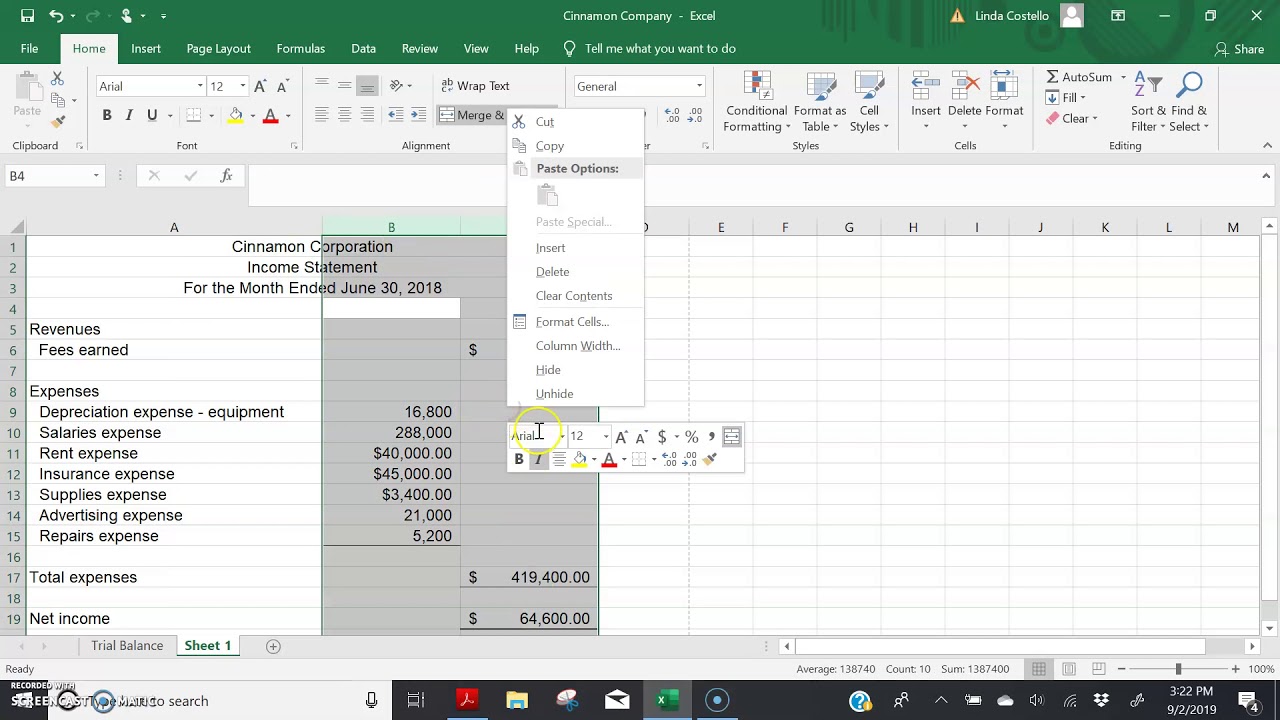
- Identify Expense Categories: Begin by identifying and categorizing the different types of expenses your business incurs. This may include categories such as salaries and wages, utilities, rent, marketing expenses, supplies, and any other relevant cost classifications.
- Dedicate Rows for Each Expense Category: Allocate individual rows in your spreadsheet for each expense category identified. This segregation ensures that each type of expenditure is clearly delineated, facilitating detailed expense reporting.
- Input Actual Expense Figures: Populate the designated cells with the actual expense figures corresponding to each category. Ensure that the data entered accurately reflects the costs incurred within the specified time period.
- Include Descriptive Labels: Accompany the expense figures with descriptive labels that provide context and clarity. For instance, if a particular expense category pertains to a specific operational area or cost type, include a brief description to elucidate the nature of the expenditure.
- Summarize Total Expenses: Dedicate a separate row or cell to calculate the total expenses by summing up the individual cost categories. This consolidated figure serves as a key metric for assessing the overall expenditure associated with running the business.
By meticulously inputting expense data in this manner, you can construct a comprehensive overview of the costs incurred by your business. This structured presentation of expenses facilitates a clear understanding of the financial resources utilized in the operational and administrative aspects of your enterprise, enabling informed decision-making and financial analysis.
Calculating Profit or Loss
After inputting the revenue and expenses into your Excel spreadsheet, the next crucial step in creating a profit and loss statement is calculating the final profit or loss figure. This essential computation provides a clear indication of the financial performance of your business over the specified period. Here’s a systematic approach to calculating profit or loss:
- Compute Gross Profit: Begin by calculating the gross profit, which is derived by subtracting the total cost of goods sold (COGS) from the total revenue. This figure represents the profitability of the core business operations before considering other expenses.
- Deduct Operating Expenses: Subtract the total operating expenses from the gross profit to arrive at the operating profit or loss. Operating expenses typically include administrative costs, marketing expenses, rent, utilities, and other overhead expenditures.
- Factor in Non-Operating Income and Expenses: If applicable, incorporate non-operating income, such as interest earnings, and non-operating expenses, such as interest payments, into the calculation. This adjustment provides a comprehensive view of the business’s overall financial performance.
- Account for Taxes: Consider the impact of taxes on the bottom line. Calculate the provision for income taxes based on the applicable tax rate and deduct it from the operating profit to arrive at the net profit or loss figure.
By meticulously performing these calculations in your Excel spreadsheet, you can derive the final profit or loss figure, which serves as a key indicator of your business’s financial success or challenges during the specified period. This comprehensive assessment of profitability and financial performance lays the groundwork for informed decision-making and strategic planning within your organization.
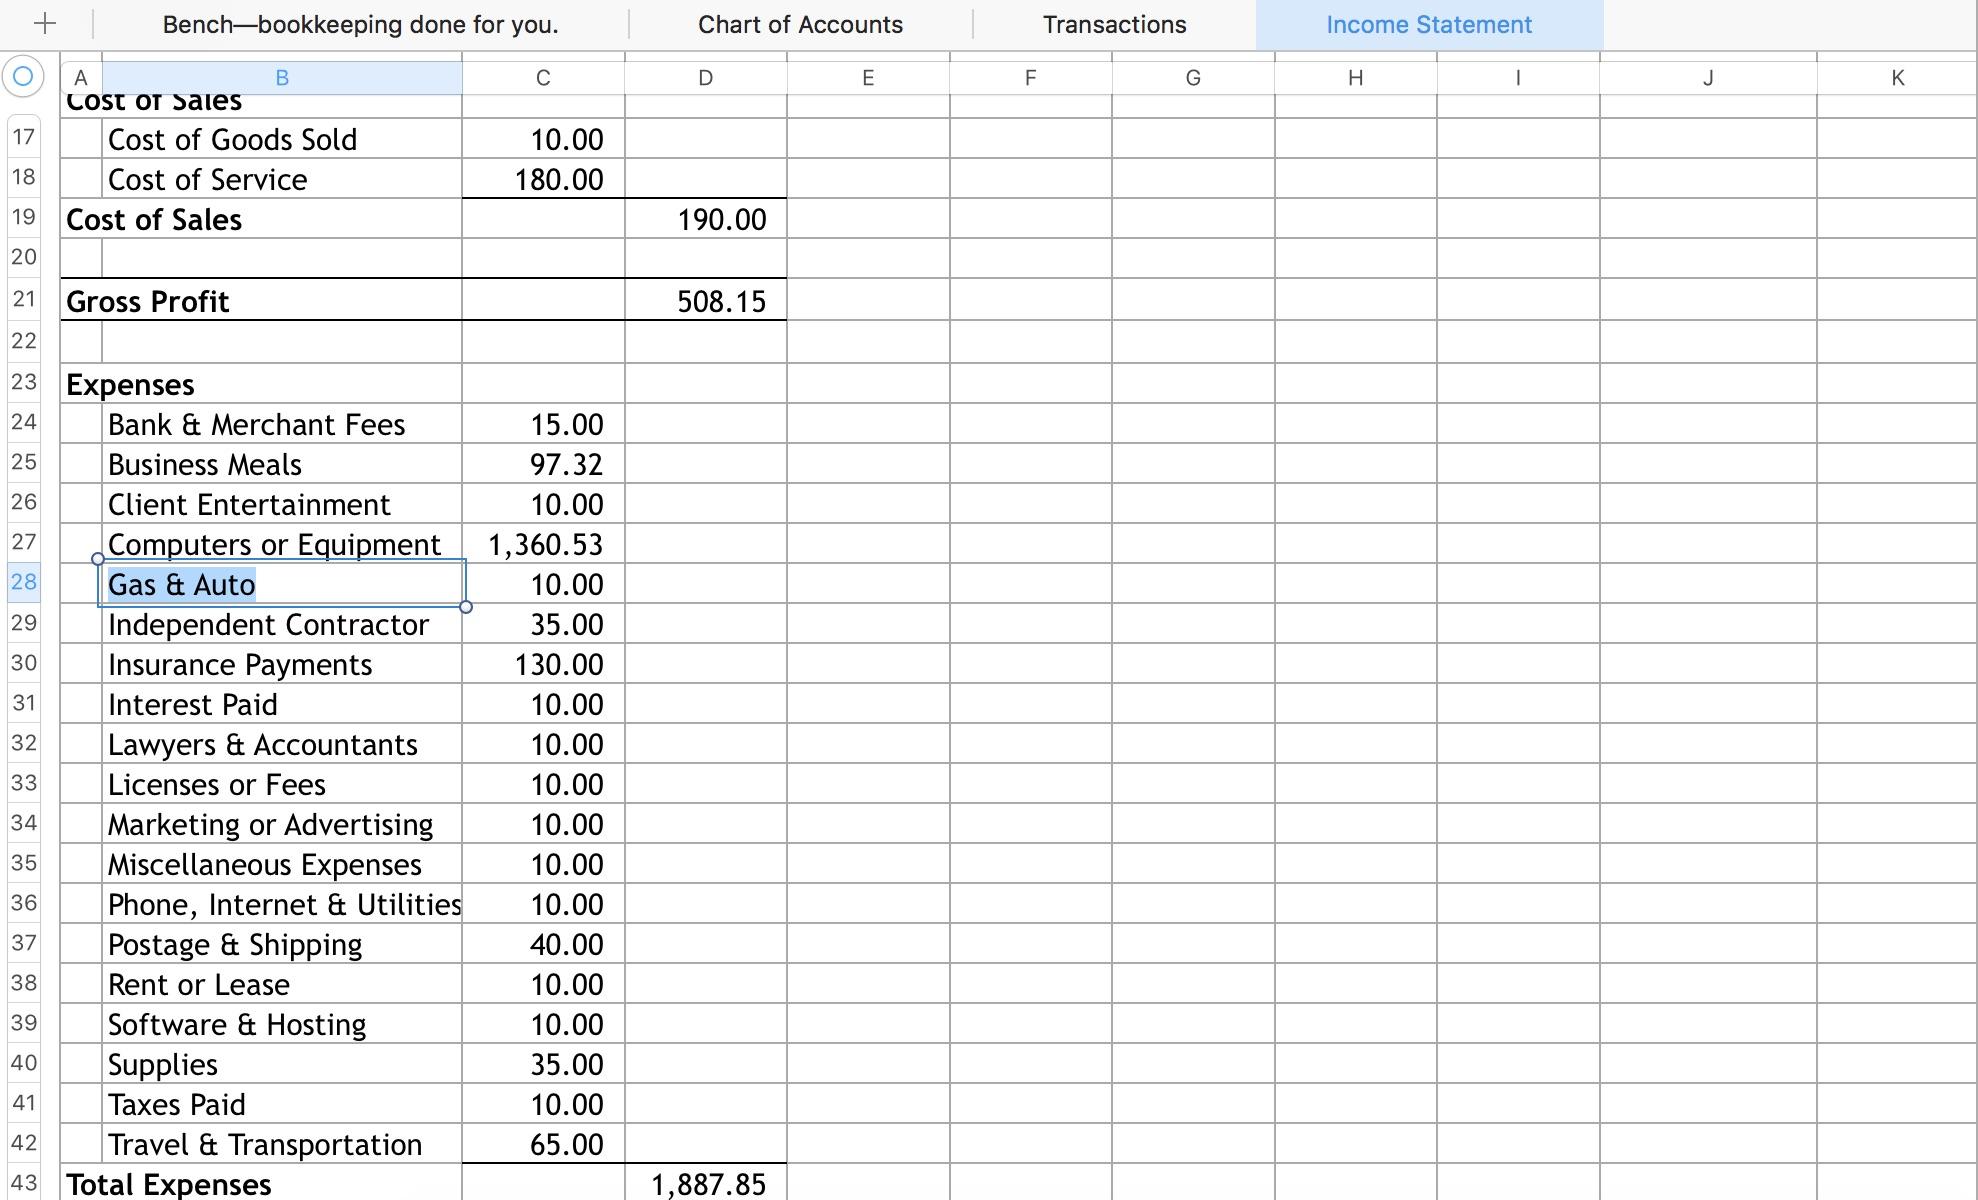
Formatting Your Profit and Loss Statement
Once the revenue, expenses, and profit or loss calculations are accurately inputted and computed in your Excel spreadsheet, the final step involves formatting the profit and loss statement for professional presentation. A well-structured and visually appealing format enhances the readability and impact of the financial data. Here’s how to format your profit and loss statement:
- Organize with Clear Headings: Use bold and distinct headings to categorize the revenue, expenses, and profit or loss sections. This visual organization makes it easy for readers to navigate the statement and locate specific information.
- Utilize Borders and Shading: Employ borders and shading to delineate different sections of the profit and loss statement. Clear visual distinctions enhance the overall presentation and create a professional look and feel.
- Highlight Key Figures: Emphasize critical figures, such as total revenue, total expenses, gross profit, operating profit, and net profit or loss, by applying bold formatting or utilizing a different font color. This draws attention to the most significant financial metrics.
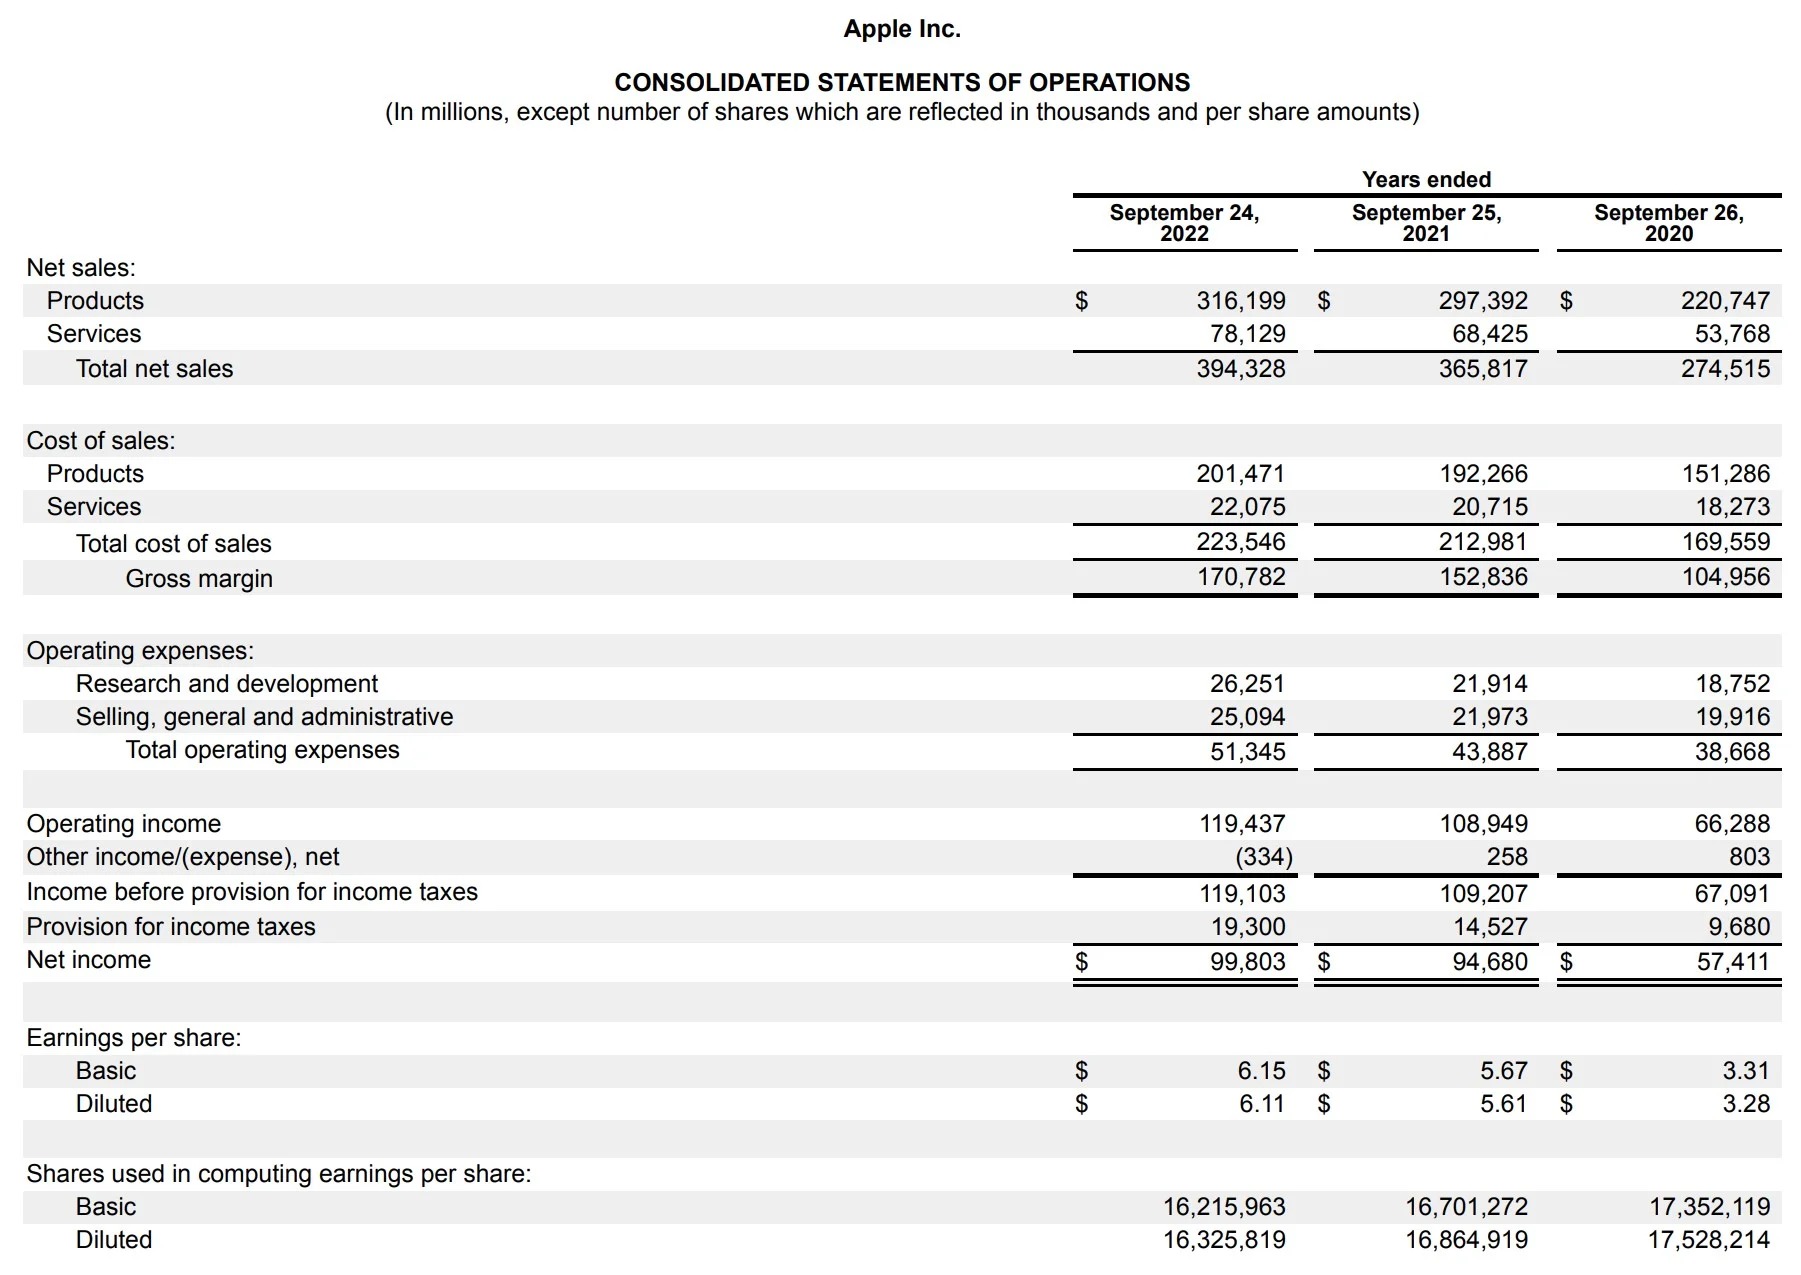
- Include Comparative Data: If applicable, consider incorporating comparative data from previous periods to enable performance analysis. Utilize side-by-side columns or additional sections to present comparative figures, offering valuable insights into the business’s financial trends.
- Add Company Branding: Infuse the profit and loss statement with your company’s branding elements, such as the logo and color scheme, to reinforce its association with your business and maintain a consistent visual identity.
By implementing these formatting techniques in your Excel spreadsheet, you can transform raw financial data into a polished and professional profit and loss statement. This visually appealing presentation enhances the document’s clarity and impact, making it an effective tool for internal decision-making, stakeholder communication, and financial analysis.
What's Hot
Latest Articles
Related Post

By: • Finance
By: • Finance

By: • Finance

By: • Finance
By: • Finance
By: • Finance

By: • Finance
By: • Finance

By: • Finance

By: • Finance

By: • Finance

By: • Finance

By: • Finance

By: • Finance