Finance
How To Prepare Financial Statements In Excel
Published: December 23, 2023
Learn how to prepare financial statements in Excel and effectively manage your finances with our comprehensive finance guide.
(Many of the links in this article redirect to a specific reviewed product. Your purchase of these products through affiliate links helps to generate commission for LiveWell, at no extra cost. Learn more)
Table of Contents
Introduction
Financial statements play a crucial role in assessing the financial health and performance of a business. They provide valuable insights into a company’s profitability, liquidity, and overall financial position. Traditionally, financial statements were prepared manually, involving complex calculations and the use of pen and paper. However, with the advent of technology, preparing financial statements has become much easier and efficient.
In today’s digital era, Excel has emerged as a powerful tool for creating and analyzing financial statements. Excel offers a wide range of functions and formulas that simplify the process of organizing financial data, performing calculations, and presenting the information in a systematic manner. Whether you’re a small business owner, an accountant, or a finance professional, using Excel for financial statements can save you time, reduce errors, and improve the accuracy and reliability of the information presented.
In this article, we will explore the benefits of using Excel for financial statements and guide you through the process of setting up your Excel workbook, designing the income statement, creating the balance sheet, developing the cash flow statement, and formatting and reviewing the financial statements.
By the end of this article, you will have the necessary knowledge and tools to prepare comprehensive and professional financial statements in Excel, enabling you to make informed financial decisions and communicate your company’s financial position effectively.
Benefits of Using Excel for Financial Statements
Excel offers numerous advantages when it comes to preparing financial statements. Here are some key benefits:
- Flexibility: Excel provides the flexibility to customize your financial statements according to your specific needs. You can easily add or remove rows and columns, adjust formatting, and incorporate graphs and charts for visual representation of the data. This flexibility allows you to tailor your financial statements to suit your desired level of detail and presentation.
- Automation: Excel has built-in functions and formulas that enable you to automate calculations and perform complex financial analysis with ease. You can use formulas like SUM, AVERAGE, and IF statements to aggregate and manipulate your financial data. This automation reduces the chance of errors and ensures accuracy in your calculations.
- Data Organization: Excel provides a structured and organized format for storing and managing your financial data. You can create separate worksheets for different financial statements, such as the income statement, balance sheet, and cash flow statement. This segregation simplifies data entry and retrieval, making it easier to track and analyze financial information.
- Data Analysis: Excel offers powerful data analysis tools that allow you to gain deeper insights into your financial statements. You can use features like PivotTables and Data Validation to manipulate and filter your data, identify trends and patterns, and perform variance analysis. These analysis capabilities help you make informed financial decisions and identify areas for improvement.
- Collaboration: Excel enables seamless collaboration among team members working on financial statements. Multiple people can work on the same workbook simultaneously, making updates and changes in real-time. You can also track changes, add comments, and protect sensitive data using Excel’s collaboration features. This promotes efficient teamwork and ensures the accuracy and consistency of the financial statements.
Overall, using Excel for financial statements provides a comprehensive and user-friendly platform for organizing, analyzing, and presenting financial data. The flexibility, automation, data organization, data analysis, and collaboration features of Excel make it an invaluable tool for finance professionals and businesses of all sizes.
Setting Up Your Excel Workbook
Before you start creating your financial statements in Excel, it’s important to set up your workbook in a structured manner. Follow these steps to ensure a well-organized and efficient workbook:
- Create Separate Worksheets: Start by creating different worksheets for each financial statement you plan to include, such as the income statement, balance sheet, and cash flow statement. This separation allows for a clear and organized presentation of the information.
- Label Each Worksheet: Give each worksheet a clear and descriptive label, such as “Income Statement,” “Balance Sheet,” or “Cash Flow Statement.” This will make it easier for yourself and others to navigate through the workbook and locate specific financial statements.
- Add Header and Footer: Include a header and footer on each worksheet to provide important details, such as the company name, report period, and page numbers. This gives your financial statements a professional look and ensures consistency across all worksheets.
- Set Up Rows and Columns: Determine the necessary rows and columns for each financial statement. Consider the level of detail you want to include and allocate sufficient space for the data. Use row and column headings to clearly label the various components of the financial statements.
- Format Cells: Apply appropriate formatting to cells to enhance readability and presentation. Use font styles, colors, and borders to differentiate titles, headings, and data. Apply number formatting to align decimal places and add thousands separators if necessary.
- Include Reference Cells: Add cells within the workbook to reference important values or calculations. For example, you can create a cell to capture the net income from the income statement and reference it in the balance sheet and cash flow statement. This ensures consistency and accuracy in your financial statements.
- Protect Sensitive Data: If you are sharing the workbook with others, consider protecting sensitive data and formulas. You can apply cell protection and password protection to prevent unauthorized changes or access to critical information.
By following these steps, you can set up a well-structured and organized Excel workbook for your financial statements. This will streamline the process of creating and updating your statements, and ensure consistency and professionalism in your presentation.
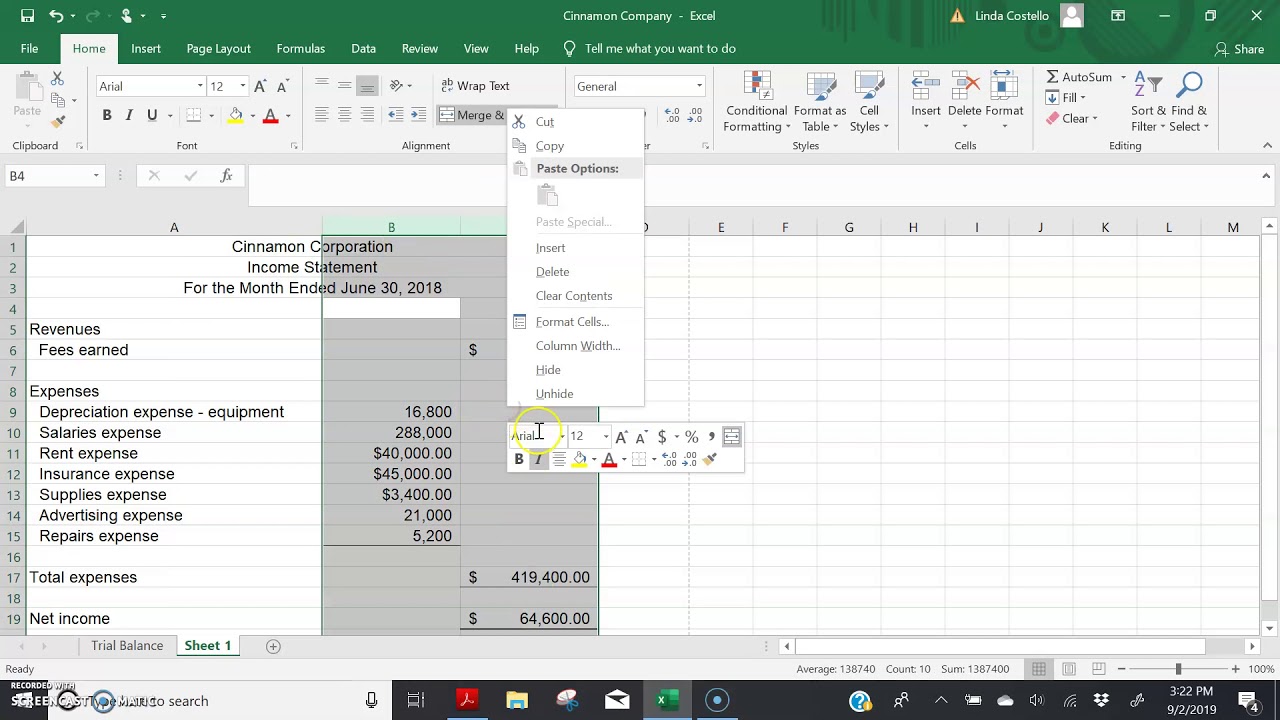
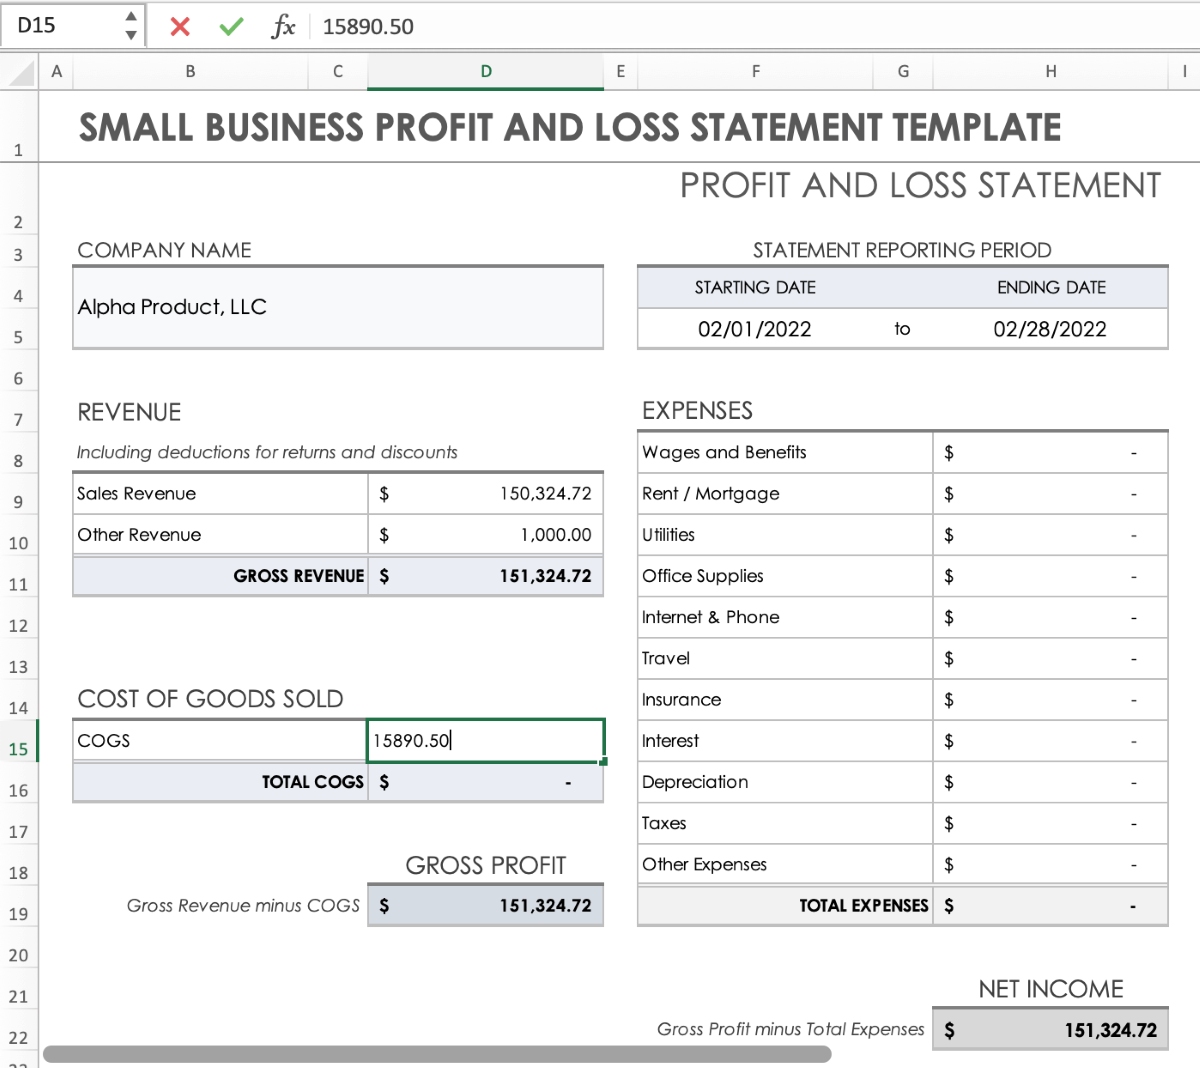
Designing the Income Statement
The income statement, also known as the profit and loss statement, is one of the most important financial statements. It provides a summary of a company’s revenues, expenses, and net income over a specific period of time. Here are the steps to design an effective income statement in Excel:
- Create Revenue Section: Start by listing all sources of revenue for your business. This can include sales, service income, interest income, and any other revenue streams. Enter the revenue amounts in the appropriate cells under the revenue section.
- Add Cost of Goods Sold (COGS): If applicable, include a section for the cost of goods sold. This comprises the direct costs associated with producing or acquiring the goods or services sold by the company. Deduct the COGS from the revenue to calculate the gross profit.
- Include Operating Expenses: Next, list all operating expenses, such as salaries, rent, utilities, marketing expenses, and any other costs associated with running the business. Enter the expense amounts in the appropriate cells under the operating expenses section.
- Calculate Operating Income: Subtract the total operating expenses from the gross profit to calculate the operating income. This represents the profit generated from the core operations of the business.
- Add Non-Operating Income and Expenses: If your business has any non-operating income or expenses, such as interest income, interest expenses, or gains/losses from investments, include a separate section for these items. Include them in the income statement accordingly.
- Calculate Net Income: Sum up the operating income and non-operating income/expenses to calculate the pre-tax net income. Subtract any taxes owed to arrive at the final net income, which represents the profit or loss after taxes.
- Consider Subtotals and Formatting: You can add subtotals for each section and format the income statement to enhance readability. Use bold text, shading, borders, and alignment to differentiate the various sections and make the information easy to comprehend.
Remember to follow a logical order when designing the income statement, ensuring that the revenue, expenses, and income figures flow in a consistent and coherent manner. Additionally, use appropriate formulas and cell references to calculate values dynamically, allowing for easy updates and adjustments in the future.
By following these steps and taking into account the specific needs and structure of your business, you can design a comprehensive and accurate income statement in Excel.
Creating the Balance Sheet
The balance sheet is a snapshot of a company’s financial position at a specific point in time. It provides an overview of the company’s assets, liabilities, and shareholders’ equity. Here’s how to create an effective balance sheet in Excel:
- List Assets: Begin by listing all the company’s assets, categorizing them into current assets and long-term assets. Examples of current assets include cash, accounts receivable, inventory, and prepaid expenses. Long-term assets may include property, plant, and equipment, intangible assets, and investments. Enter the corresponding values in the respective cells.
- Add Liabilities: Next, list the company’s liabilities, separating them into current liabilities and long-term liabilities. Current liabilities typically consist of accounts payable, short-term debt, and accrued expenses. Long-term liabilities may include long-term debt and deferred tax liabilities. Enter the corresponding values in the respective cells.
- Calculate Shareholders’ Equity: Shareholders’ equity represents the residual interest in the company’s assets after deducting liabilities. It includes the company’s retained earnings and any additional paid-in capital. Calculate the shareholders’ equity by subtracting the total liabilities from the total assets.
- Format and Align: Apply formatting to the balance sheet to improve readability. Use borders, shading, and font formatting to visually separate different sections of the balance sheet. Ensure the assets, liabilities, and shareholders’ equity are aligned properly for clear presentation.
- Add Totals and Subtotals: Include subtotals for current assets, long-term assets, current liabilities, and long-term liabilities for easier analysis. Sum up the values for each category and calculate the total assets and total liabilities. You can also include a grand total for the balance sheet.
- Check Balance: Ensure that the balance sheet equation balances: Assets = Liabilities + Shareholders’ Equity. If the equation doesn’t balance, review your entries and formulas to identify any errors or omissions.
It’s important to note that the balance sheet should be formatted in a way that presents a clear picture of the company’s financial position. Use appropriate headings, labels, and descriptions to make the information easily understandable for stakeholders.
By following these steps and customizing the balance sheet to your specific business’s needs, you can create a comprehensive and accurate balance sheet in Excel.
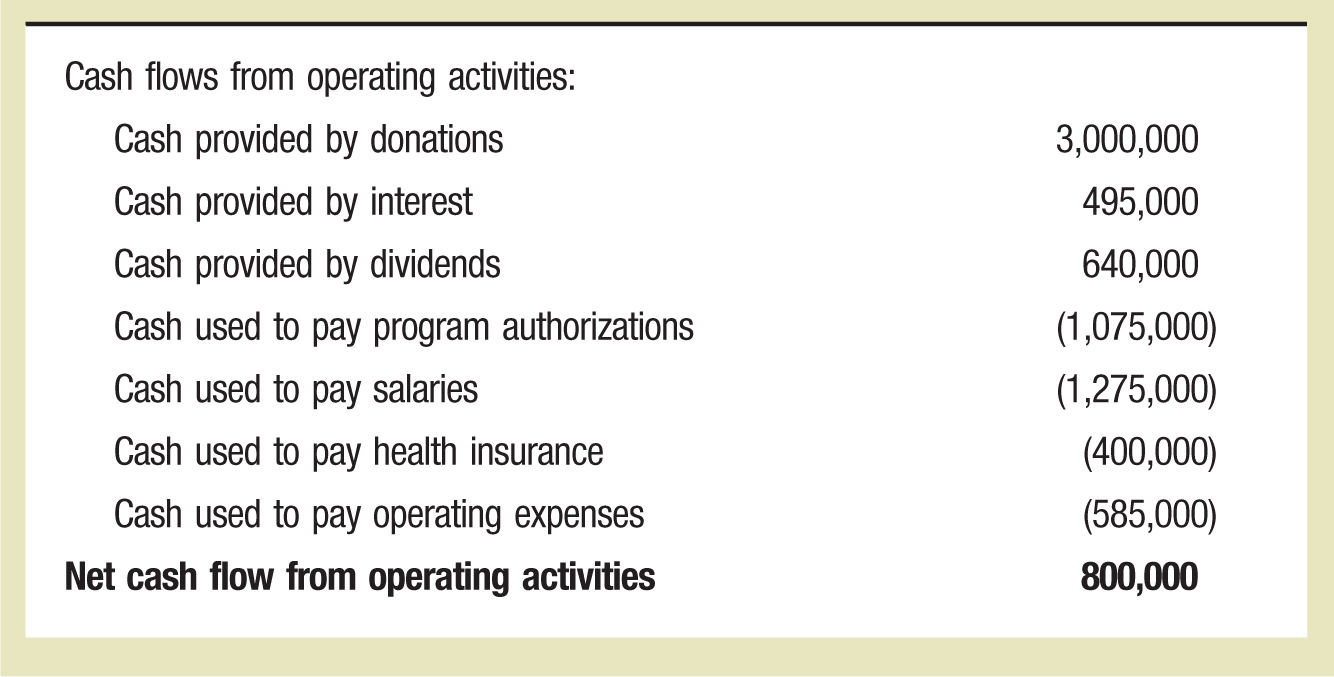
Developing the Cash Flow Statement
The cash flow statement provides valuable insights into a company’s cash inflows and outflows over a specific period. It tracks the movement of cash from operating activities, investing activities, and financing activities. Here’s how to develop a cash flow statement in Excel:
- Start with Operating Activities: Begin by listing the company’s cash inflows and outflows from its primary operations. This may include cash received from customers, payments made to suppliers, and operating expenses. Categorize these items into operating cash inflows and operating cash outflows.
- Include Investing Activities: Next, list any cash inflows and outflows related to investing activities. This could involve the purchase or sale of assets, investments in other companies, or loans extended to other entities. Separate these items into investing cash inflows and investing cash outflows.
- Add Financing Activities: Include any cash inflows and outflows associated with financing activities. This may involve the issuance or repayment of debt, proceeds from the issuance of stock, or payment of dividends. Categorize these items into financing cash inflows and financing cash outflows.
- Calculate Net Cash Flow: Sum up the cash inflows and outflows from each category to determine the net cash flow for the period. Calculate the net increase or decrease in cash by subtracting the cash outflows from the cash inflows.
- Include Beginning and Ending Cash: Include the beginning cash balance at the start of the period and calculate the ending cash balance by adding the net cash flow to the beginning cash balance. These figures provide a reference for the overall cash position of the company.
- Format and Align: Apply formatting to the cash flow statement for clarity and readability. Use borders, shading, and font formatting to differentiate the various sections and make it easier for readers to navigate and understand the information.
- Check Accuracy: Double-check all the figures and formulas in the cash flow statement to ensure accuracy. Any discrepancies or errors can greatly impact the financial analysis and decision-making process.
Remember, the cash flow statement is crucial for assessing a company’s ability to generate and manage cash. It provides important information for investors, lenders, and stakeholders to understand the company’s liquidity and cash flow trends.
By following these steps and customizing the cash flow statement based on your business’s specific cash activities, you can create a comprehensive and insightful cash flow statement in Excel.
Formatting and Reviewing the Financial Statements
Once you have created your financial statements in Excel, it’s essential to format them properly and review them for accuracy. Here are some key steps to follow:
- Consistent Formatting: Ensure consistency in formatting across all financial statements. Use the same font, font size, and font color. Maintain consistent alignment, indentation, and spacing to enhance readability and presentation.
- Clear Titles and Headings: Use clear and descriptive titles for each financial statement. Include headings for different sections to make it easier for readers to navigate through the statements and locate specific information.
- Highlight Key Figures: Use formatting techniques to highlight key figures in the financial statements. You can make important numbers bold or use a different font color. This draws attention to crucial information and facilitates quick analysis.
- Use Graphs and Charts: Incorporate graphs and charts to visually represent the data in the financial statements. Graphs can provide a clearer understanding of trends, comparisons, and proportions. Choose appropriate graph types, such as bar graphs, line graphs, or pie charts, based on the nature of the data.
- Ensure Accuracy: Review the financial statements meticulously for accuracy. Check all calculations, formulas, and references to ensure they are correct. Verify that the figures match the supporting documentation and transaction records.
- Compare Periods: Perform a comparative analysis by comparing the current financial statements with previous periods. Look for trends, changes, and significant differences in the numbers. This analysis provides valuable insights into the company’s performance and financial health.
- Proofread and Review: Proofread the financial statements for any spelling or grammatical errors. Review the statements to ensure they provide a comprehensive and coherent picture of the company’s financial position and performance. Thoroughly review all supporting schedules and footnotes for accuracy and completeness.
Formatting and reviewing the financial statements not only improves their visual appeal but also ensures the accuracy and reliability of the information presented. Clear and well-formatted financial statements convey professionalism and enhance the credibility of the company.
By following these steps, you can format and review your financial statements effectively, enabling you to present accurate and meaningful information to stakeholders, investors, and other interested parties.
Conclusion
Creating financial statements in Excel provides numerous benefits, including flexibility, automation, and data organization. Excel allows you to design comprehensive and professional financial statements while saving time and reducing errors. By following the steps outlined in this article, you can prepare accurate and informative income statements, balance sheets, and cash flow statements.
Remember to set up your Excel workbook in a structured manner, with separate worksheets for each financial statement. Format each statement with clear headings, consistent formatting, and highlighting key figures. Double-check formulas and references to ensure accuracy.
Excel’s ability to automate calculations and perform data analysis makes it a valuable tool for preparing financial statements. You can use the built-in functions and formulas to perform complex calculations and gain insights into your company’s financial performance.
Don’t forget to review your financial statements for accuracy and completeness. Compare them to previous periods to identify trends and changes in financial performance.
In conclusion, using Excel to prepare financial statements is a practical and efficient way to present vital financial information. It empowers businesses of all sizes to make informed decisions, communicate their financial position effectively, and meet the requirements of stakeholders.
By leveraging the capabilities of Excel and following the steps outlined in this article, you can create comprehensive and polished financial statements that serve as invaluable tools for understanding and managing your company’s finances.
What's Hot
Latest Articles
Related Post

By: • Finance

By: • Finance

By: • Finance
By: • Finance

By: • Finance

By: • Finance
By: • Finance

By: • Finance

By: • Finance

By: • Finance


By: • Finance

By: • Finance