Home>Finance>Where To Find Inventory Turnover On Financial Statements

Finance
Where To Find Inventory Turnover On Financial Statements
Modified: March 1, 2024
Learn where to find inventory turnover on financial statements in this comprehensive guide. Understand the finance aspect of tracking inventory and optimizing your business operations.
(Many of the links in this article redirect to a specific reviewed product. Your purchase of these products through affiliate links helps to generate commission for LiveWell, at no extra cost. Learn more)
Table of Contents
Introduction
Understanding the financial health of a company is essential for investors, creditors, and other stakeholders. Financial statements provide valuable insights into a company’s performance and help assess its ability to generate profits and manage its resources effectively. One crucial aspect of financial analysis is inventory turnover, which measures how efficiently a company manages its inventory.
Inventory turnover, also known as stock turnover, is a key financial ratio that quantifies the number of times a company’s inventory is sold and replaced within a given period. It indicates how quickly a company is able to sell its inventory and replenish it with new stock. A high inventory turnover ratio suggests that a company is selling its products quickly, while a low ratio indicates that a company is struggling to sell its inventory.
Understanding inventory turnover is important for several reasons. Firstly, it helps businesses optimize their inventory management, ensuring they have enough stock to meet customer demand while minimizing the risk of overstocking and obsolescence. Secondly, it provides insights into a company’s efficiency in converting its inventory into sales and its ability to generate revenue. Lastly, it helps investors and creditors make informed decisions by assessing the financial health and operational efficiency of a company.
In order to analyze inventory turnover, it is crucial to know where to find this information on a company’s financial statements. The three primary financial statements – the income statement, balance sheet, and cash flow statement – each play a role in providing information about inventory turnover ratios.
What is Inventory Turnover?
Inventory turnover is a financial metric that measures how efficiently a company manages its inventory. It calculates the number of times a company sells and replaces its inventory over a specific period, typically a year. This ratio helps understand the speed at which a company is able to sell its products and restock its inventory.
The formula for calculating inventory turnover is:
Inventory Turnover Ratio = Cost of Goods Sold / Average Inventory
The cost of goods sold (COGS) represents the direct costs associated with producing or purchasing the goods that have been sold during the period. Average inventory is calculated by adding the beginning and ending inventories and dividing the sum by 2. The resulting ratio indicates how many times a company’s inventory has been sold and replaced within the given period.
A high inventory turnover ratio suggests that a company is efficiently managing its inventory by quickly selling products and restocking, which can be indicative of strong sales and efficient operations. On the other hand, a low inventory turnover ratio implies slow-moving or stagnant inventory, which may indicate issues such as overstocking, obsolete products, or poor sales performance.
It’s important to note that inventory turnover ratios vary across industries. Some industries, such as technology or fashion, may have higher turnover ratios due to rapidly changing trends and shorter product lifecycles. Industries with longer product lifecycles, such as manufacturing or heavy equipment, may have lower turnover ratios.
Inventory turnover ratios can also be compared with industry benchmarks and historical data to assess a company’s performance. By analyzing trends over time and comparing them to competitors, investors and stakeholders can gain insights into a company’s efficiency in managing its inventory and generating revenue.
Importance of Inventory Turnover
Inventory turnover is a critical metric that holds significant importance for businesses and stakeholders. It provides valuable insights into the efficiency and effectiveness of a company’s inventory management. Here are some key reasons why inventory turnover is important:
1. Operational Efficiency: A high inventory turnover ratio indicates that a company is selling its products quickly and efficiently. This suggests that the company has a streamlined supply chain, effective sales strategies, and strong customer demand. It also signifies that the company is managing its inventory levels optimally, avoiding overstocking or stockouts, which can impact profitability and customer satisfaction.
2. Working Capital Management: Inventory represents a substantial portion of a company’s working capital. By analyzing inventory turnover, businesses can ensure that they are not tying up excessive capital in inventory. A high inventory turnover ratio allows companies to free up cash that can be used for other business purposes, such as investing in new products, expanding operations, or paying off debts.
3. Cost Control: Holding excess inventory can lead to several costs, including storage costs, insurance expenses, and the risk of obsolescence. By monitoring inventory turnover, businesses can identify slow-moving or obsolete inventory and take actions to minimize these costs. Additionally, a high turnover ratio can help reduce the need for discounting or liquidating inventory to clear out excess stock, preserving profit margins.
4. Sales and Revenue Generation: Inventory turnover provides insights into a company’s ability to convert inventory into sales and generate revenue. A high turnover ratio suggests that the company is effectively meeting customer demand, maximizing sales opportunities, and capitalizing on market trends. This can lead to increased revenue and profitability for the business.
5. Investor and Creditor Confidence: Inventory turnover is an essential factor when investors and creditors evaluate a company’s financial health and operational efficiency. A high turnover ratio indicates efficient resource management and can boost investor confidence, making the company more attractive for investment or lending opportunities. On the other hand, a low turnover ratio may raise concerns about inventory management and signal potential risks.
By analyzing inventory turnover and taking the necessary actions to optimize inventory management, businesses can improve operational efficiency, reduce costs, generate revenue, and enhance investor confidence. It is a key performance indicator that helps businesses stay competitive and financially healthy in today’s dynamic market environment.
Where to Find Inventory Turnover on Financial Statements
To analyze a company’s inventory turnover, it is essential to know where to find this information on their financial statements. The three primary financial statements – the income statement, balance sheet, and cash flow statement – provide key details needed to calculate and assess inventory turnover ratios.
Let’s explore where to find inventory turnover on financial statements:
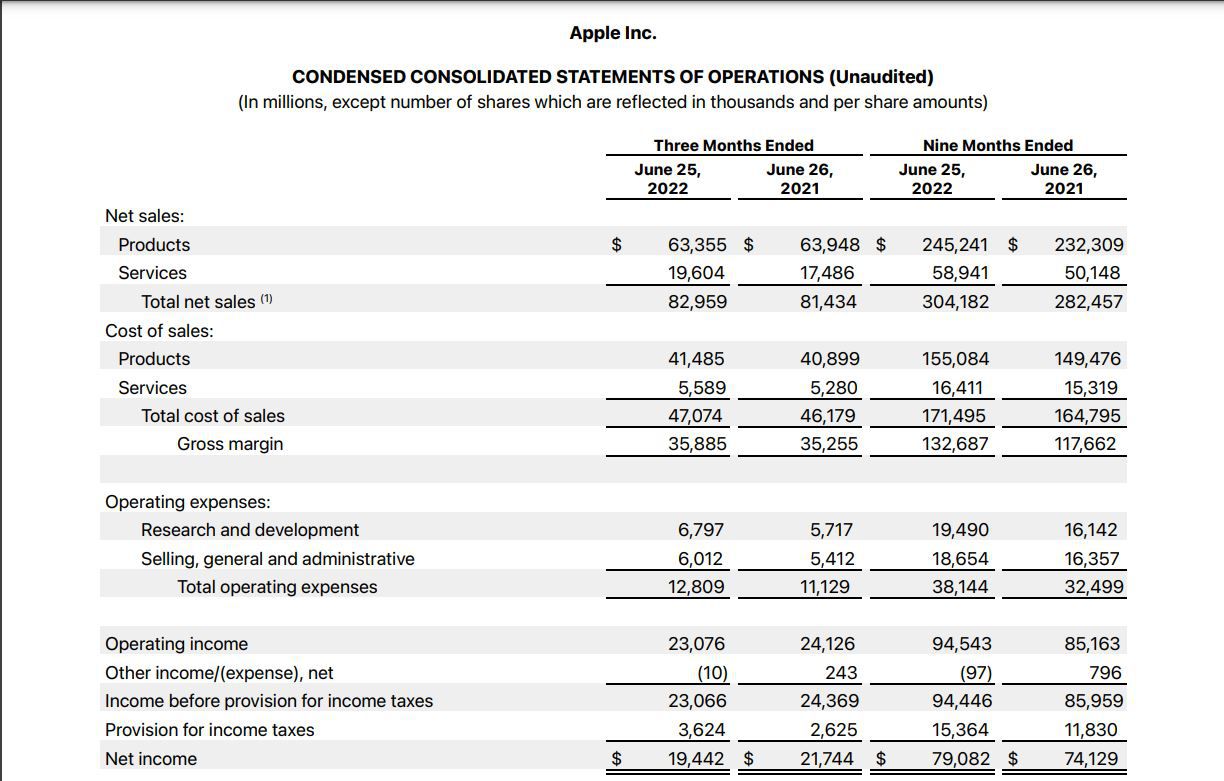
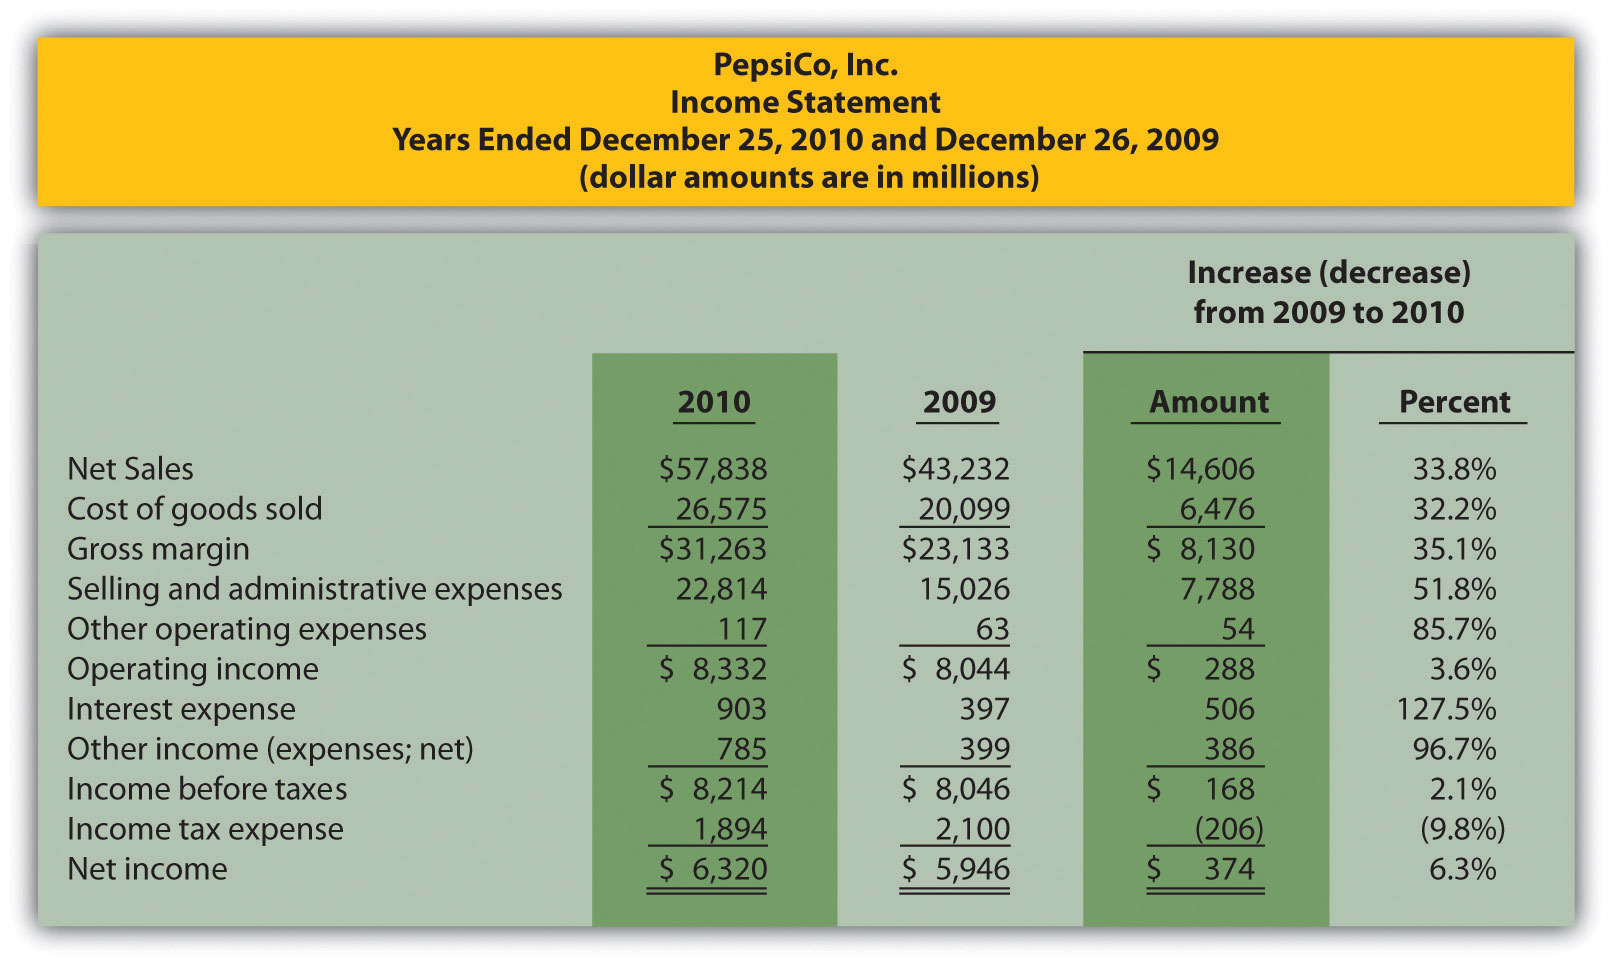
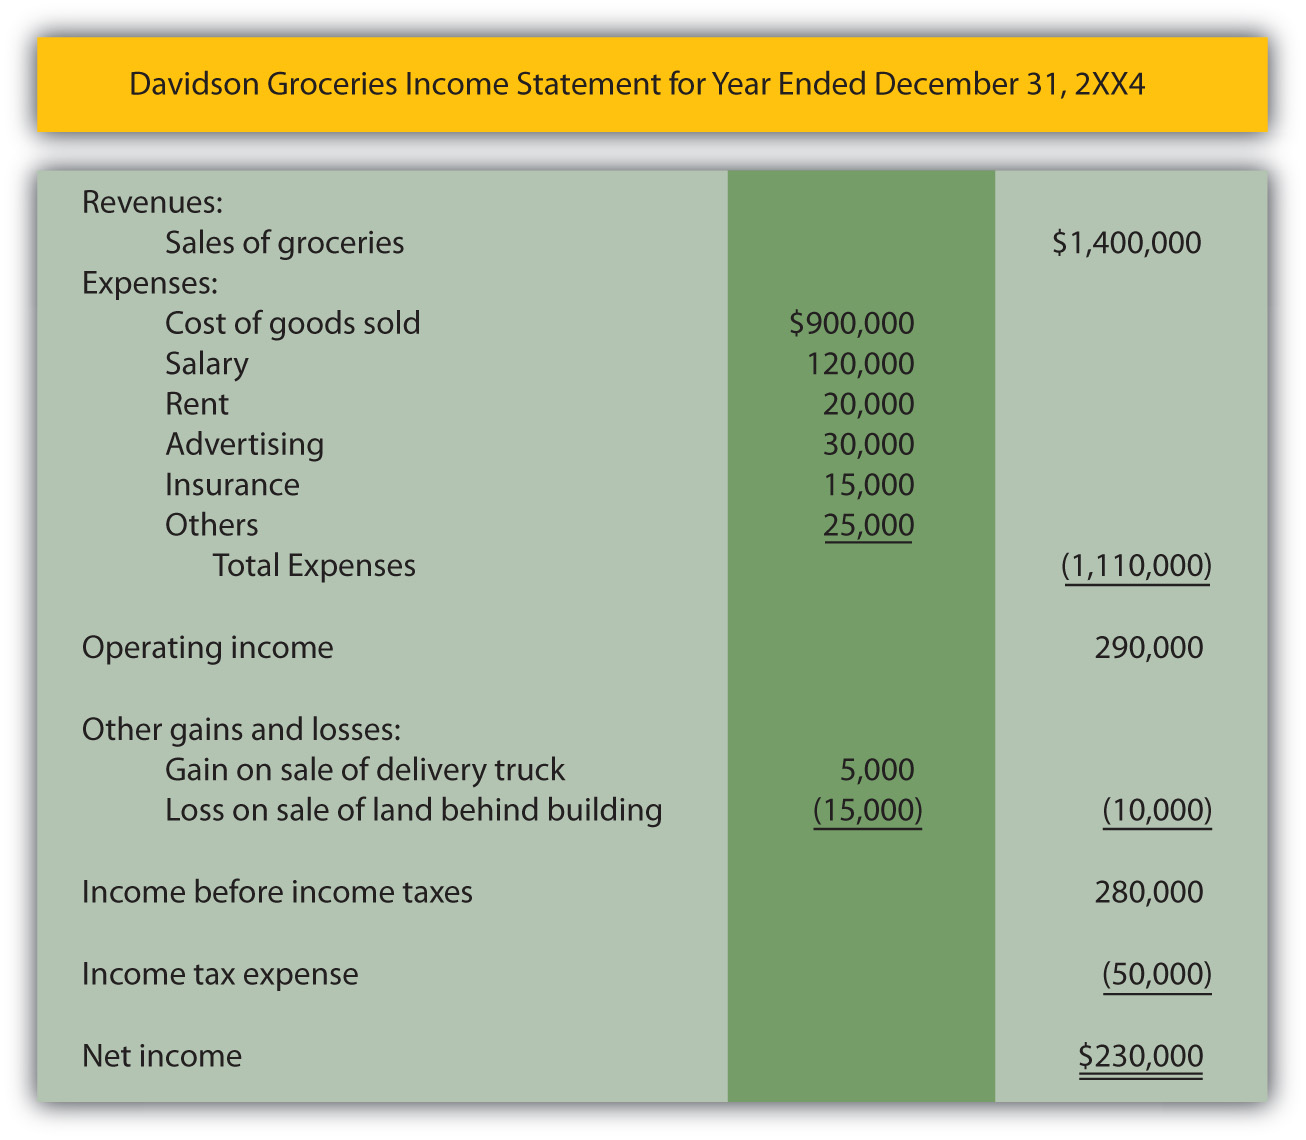
- Income Statement: The income statement, also known as the profit and loss statement, provides insights into a company’s revenue, expenses, and profitability over a specific period. To calculate inventory turnover, it is crucial to find the cost of goods sold (COGS) on the income statement. The COGS represents the direct costs associated with producing or purchasing the goods that have been sold during the period. It is typically located as a line item below the revenue section.
- Balance Sheet: The balance sheet provides a snapshot of a company’s financial position at a specific point in time. To find the necessary information for calculating inventory turnover, it is important to locate two key components: inventory and accounts payable. Inventory is listed as a current asset on the balance sheet, and it represents the value of the products or materials held by the company. Accounts payable, listed as a current liability, represents the amount owed by the company to its suppliers for inventory purchases.
- Cash Flow Statement: The cash flow statement provides information about a company’s cash inflows and outflows during a specific period. To find the relevant data for analyzing inventory turnover, it is crucial to look at the change in inventory section. This section shows any increase or decrease in the value of inventory during the period and is typically found in the operating activities section of the cash flow statement.
By analyzing the aforementioned information from the income statement, balance sheet, and cash flow statement, stakeholders can calculate and evaluate inventory turnover ratios. This analysis provides insights into a company’s ability to manage its inventory efficiently and convert it into sales.
It is worth noting that each industry may have different benchmarks for inventory turnover ratios due to variations in products, supply chains, and sales cycles. Therefore, it is important to compare a company’s inventory turnover ratios with industry averages and historical data to gain a comprehensive understanding of its performance.
Income Statement
The income statement, also known as the profit and loss statement, provides a summary of a company’s revenues, expenses, and net income over a specific period. It contains valuable information for calculating inventory turnover and assessing a company’s financial performance.
To find the necessary data for inventory turnover on the income statement, you need to locate the cost of goods sold (COGS) figure. The COGS represents the direct costs associated with producing or purchasing the goods that have been sold during the period.
The COGS is typically found as a line item below the revenue section of the income statement. It includes the costs directly related to production or procurement of goods, such as raw materials, labor, and manufacturing overhead. The COGS does not include indirect costs, such as administrative expenses or marketing costs.
Once you have identified the COGS figure, you can use it along with the average inventory value to calculate the inventory turnover ratio. The average inventory can be derived by averaging the beginning and ending inventory balances for the given period.
By analyzing the inventory turnover ratio derived from the income statement, you can assess how effectively a company is managing its inventory and converting it into sales. A high ratio indicates that the company is selling its products quickly, while a low ratio may suggest problems in inventory management, such as overstocking or slow-moving inventory.
It is important to consider industry benchmarks and historical data when evaluating inventory turnover ratios from the income statement. A ratio that is higher or lower than industry norms may indicate superior or subpar performance, respectively. Additionally, comparing inventory turnover ratios over time allows you to identify trends and assess improvements or deterioration in inventory management.
Ultimately, the income statement provides critical information that, when combined with other financial statements, offers a comprehensive view of a company’s inventory turnover and financial performance. By analyzing the income statement, stakeholders can make informed decisions and better understand a company’s ability to generate profits through efficient inventory management.
Balance Sheet
The balance sheet is a financial statement that provides a snapshot of a company’s assets, liabilities, and shareholders’ equity at a specific point in time. It contains valuable information for analyzing a company’s inventory turnover and evaluating its financial health.
To find the necessary data for inventory turnover on the balance sheet, you need to locate two key components: inventory and accounts payable.
Inventory: Inventory is listed as a current asset on the balance sheet. It represents the value of the products or materials held by the company. The inventory value includes the cost of acquiring or producing the goods, along with any associated storage or handling costs. It is important to note that inventory is reported at the lower of cost or net realizable value, taking into account potential obsolescence or declines in market value.
Accounts Payable: Accounts payable is listed as a current liability on the balance sheet. It represents the amount owed by the company to its suppliers for inventory purchases. These are short-term obligations that need to be paid within a specific time period. Accounts payable typically includes both trade payables, which are unpaid invoices for goods or services received, and other payables related to inventory procurement.
To calculate the inventory turnover ratio, you will need the cost of goods sold (COGS) from the income statement and the average inventory value. The average inventory value is calculated by adding the beginning and ending inventory balances and dividing the sum by 2.
By analyzing the inventory turnover ratio derived from the balance sheet, you can assess how efficiently a company is managing its inventory and converting it into sales. A high ratio suggests that inventory is being sold quickly, while a low ratio may indicate issues such as overstocking or slow-moving inventory.
When evaluating inventory turnover ratios from the balance sheet, it is important to consider industry benchmarks and historical data. Comparing a company’s ratios with industry averages helps determine how it performs relative to its peers. Additionally, tracking inventory turnover ratios over time allows for identifying trends and evaluating changes in inventory management efficiency.
Overall, the balance sheet is a valuable source of information for understanding a company’s inventory turnover and assessing its financial stability. By analyzing the balance sheet, stakeholders can gain insights into a company’s ability to effectively manage inventory and make well-informed decisions.
Cash Flow Statement
The cash flow statement is a financial statement that provides information about a company’s cash inflows and outflows during a specific period. While it may not directly include inventory turnover figures, it plays a crucial role in understanding the movement of cash related to inventory transactions.
To find relevant information for analyzing inventory turnover on the cash flow statement, you need to focus on the “change in inventory” section. This section shows any increase or decrease in the value of inventory during the period.
The change in inventory value is typically found in the operating activities section of the cash flow statement. It reflects the impact of inventory-related transactions, such as inventory purchases, cost of goods sold, and any adjustments for inventory valuation.
By examining the change in inventory value over time, you can gain insights into the company’s cash flow related to inventory. For example, a significant increase in inventory may indicate a build-up of stock, while a decrease in inventory may suggest high sales or efficient inventory management.
While the cash flow statement does not directly provide inventory turnover ratios, it offers a complementary perspective by highlighting the cash flow implications of inventory-related activities. Understanding the cash flow impact of inventory can help identify potential liquidity issues, working capital management concerns, or areas where adjustments in inventory levels may be needed.
When combined with information from the income statement and the balance sheet, the cash flow statement provides a comprehensive picture of a company’s inventory turnover. It allows stakeholders to evaluate the company’s ability to convert inventory into cash and assess its cash flow sustainability.
It is important to note that analyzing inventory turnover based on the cash flow statement should be done in conjunction with the income statement and the balance sheet. Consider industry benchmarks and historical data to gain a broader context and make meaningful comparisons.
In summary, while the cash flow statement does not directly provide inventory turnover ratios, it offers valuable insights into the cash flow implications of inventory-related activities. By analyzing the change in inventory value, stakeholders can better understand a company’s cash flow dynamics and the impact of inventory on its overall financial performance.
Benefits of Analyzing Inventory Turnover
Analyzing inventory turnover provides several benefits for businesses and stakeholders. It offers valuable insights into a company’s inventory management practices, operational efficiency, and financial performance. Here are some key benefits of analyzing inventory turnover:
1. Optimized Inventory Management: By analyzing inventory turnover, businesses can identify and address inefficiencies in their inventory management practices. A high turnover ratio suggests that inventory is being sold quickly, indicating effective inventory control and avoidance of overstocking. On the other hand, a low turnover ratio may highlight issues like slow-moving or obsolete inventory, prompting businesses to adjust their purchasing or production strategies.
2. Cash Flow Management: Efficient inventory turnover can have a positive impact on cash flow. High turnover ratios indicate that products are being sold quickly, generating cash inflows. This efficient conversion of inventory into sales helps businesses maintain healthier cash flow positions by reducing the risk of tying up excessive capital in inventory or experiencing cash flow constraints due to slow-moving inventory.
3. Cost Control: Analyzing inventory turnover helps control costs associated with holding inventory. High inventory turnover ratios suggest that inventory is being sold quickly, minimizing storage and holding costs. Additionally, by identifying slow-moving or obsolete inventory, companies can take measures to reduce potential losses by discounting or liquidating the inventory, avoiding unnecessary costs and preserving profit margins.
4. Sales and Revenue Growth: Monitoring inventory turnover ratios allows businesses to gauge their ability to convert inventory into sales. A high turnover ratio indicates that products are in demand and being sold effectively, leading to increased sales and revenue growth. By analyzing inventory turnover, businesses can identify opportunities to improve sales strategies, optimize production, and capitalize on market trends.
5. Improved Financial Analysis: Inventory turnover is an important metric for financial analysis. Investors, creditors, and stakeholders often use inventory turnover ratios as part of their assessment of a company’s financial health. By comparing a company’s inventory turnover to industry benchmarks, historical data, and competitors, stakeholders can gain insights into its operational efficiency and ability to generate profits.
6. Forecasting and Planning: Analyzing inventory turnover over time can help businesses make more accurate forecasts and plan their inventory needs. By understanding historical trends in inventory turnover and considering market demands, businesses can make informed decisions about procurement, production, and pricing strategies, ensuring adequate inventory levels while minimizing the risk of overstocking or stockouts.
Overall, analyzing inventory turnover provides valuable insights that can drive improvements in inventory management, cash flow, cost control, sales growth, financial analysis, and planning. By monitoring and optimizing inventory turnover ratios, businesses can enhance operational efficiency, sustainability, and profitability.
Conclusion
Inventory turnover is a vital metric for businesses and stakeholders to evaluate the efficiency of inventory management and assess a company’s financial performance. By understanding where to find inventory turnover on financial statements and analyzing this information, businesses can optimize their inventory management practices, enhance cash flow, control costs, and drive sales growth.
The income statement provides the cost of goods sold (COGS), which is crucial for calculating inventory turnover ratios. The balance sheet offers insight into inventory and accounts payable, key components necessary for inventory turnover analysis. The cash flow statement showcases the change in inventory value and provides a view of the cash flow implications of inventory-related activities.
Analyzing inventory turnover ratios brings several benefits. It helps businesses optimize inventory management, ensuring the right balance between meeting customer demand and minimizing costs associated with excess or obsolete inventory. Efficient inventory turnover positively impacts cash flow by converting inventory into sales and reducing capital tied up in inventory. It enables businesses to control costs, identify sales and revenue growth opportunities, make informed financial decisions, and improve forecasting and planning.
To leverage the benefits of analyzing inventory turnover effectively, it is important to consider industry benchmarks, historical data, and trends over time. This allows for meaningful comparisons and helps businesses identify opportunities for improvement and address potential risks.
In conclusion, analyzing inventory turnover provides a comprehensive understanding of a company’s inventory management practices and financial performance. By utilizing this information, businesses can make data-driven decisions, enhance operational efficiency, and drive sustainable growth in today’s competitive market.
What's Hot
Latest Articles
Related Post

By: • Finance
By: • Finance
By: • Finance
By: • Finance

By: • Finance

By: • Finance
By: • Finance

By: • Finance


By: • Finance

By: • Finance

By: • Finance