Home>Finance>How Do You Calculate The Correlation Between The Cash Prices And Each Of The Futures Contracts
Finance
How Do You Calculate The Correlation Between The Cash Prices And Each Of The Futures Contracts
Published: December 23, 2023
Learn how to calculate the correlation between cash prices and futures contracts in finance. Find out the relationship between these two variables.
(Many of the links in this article redirect to a specific reviewed product. Your purchase of these products through affiliate links helps to generate commission for LiveWell, at no extra cost. Learn more)
Table of Contents
- Introduction
- Understanding Correlation
- The Importance of Correlation in Cash Prices and Futures Contracts
- Methodology for Calculating Correlation
- Gathering Data for Cash Prices and Futures Contracts
- Step-by-Step Guide to Calculating Correlation
- Interpretation of Correlation Results
- Limitations and Considerations in Calculating Correlation
- Real-World Applications of Correlation Analysis in Cash Prices and Futures Contracts
- Conclusion
Introduction
Welcome to the world of finance, where the interplay between cash prices and futures contracts is a fundamental aspect of market dynamics. Understanding the correlation between these two variables can provide valuable insights for investors, traders, and financial analysts.
Correlation is a statistical measure that quantifies the relationship between two variables. It indicates the degree and direction of the linear association between them. In the context of cash prices and futures contracts, correlation reveals how closely these two elements move together over a specific time frame.
While cash prices denote the actual market price of a financial instrument at a given point in time, futures contracts are agreements to buy or sell an asset at a predetermined price on a future date. Futures contracts enable market participants to hedge, speculate, and manage risk exposure.
Understanding the correlation between cash prices and futures contracts is crucial for several reasons. Firstly, it helps identify the level of dependence or independence between these two variables. This knowledge can guide investment decision-making and risk management strategies.
Secondly, correlation analysis provides insights into market efficiency. If the correlation between cash prices and futures contracts is high, it suggests that the market is efficient in reflecting new information and price changes in both markets. Conversely, a low or negative correlation may indicate market inefficiency.
Lastly, correlation analysis can help evaluate the performance of trading strategies. By assessing the historical correlation between cash prices and futures contracts, traders can refine their strategies and adapt to changing market conditions.
Calculating the correlation between cash prices and futures contracts involves a systematic approach. It requires gathering historical data, performing mathematical calculations, and interpreting the results effectively. In the next sections, we will explore the methodology and steps involved in this process, along with practical applications, limitations, and considerations.
So, fasten your seatbelts and get ready to dive into the fascinating world of correlation analysis in cash prices and futures contracts!
Understanding Correlation
Correlation is a statistical measure that quantifies the strength and direction of the relationship between two variables. In the context of finance, understanding correlation is essential for analyzing the relationship between cash prices and futures contracts.
Correlation ranges from -1 to +1. A correlation coefficient of +1 indicates a perfect positive relationship, meaning that the variables move in the same direction at all times. Conversely, a correlation coefficient of -1 signifies a perfect negative relationship, where the variables move in opposite directions consistently. A correlation coefficient of 0 indicates no relationship between the variables.
The magnitude of the correlation coefficient represents the strength of the relationship. A correlation coefficient close to +1 or -1 reflects a strong association between the variables, while a correlation coefficient closer to 0 suggests a weak or no correlation.
It is important to note that correlation does not imply causation. Just because two variables are highly positively correlated does not necessarily mean that one variable directly causes changes in the other. Correlation simply indicates that the variables tend to move together or in opposite directions.
Understanding the correlation between cash prices and futures contracts can provide valuable insights into market dynamics. A high positive correlation suggests that changes in cash prices are closely reflected in the movement of futures contract prices. This indicates a strong relationship and suggests that these markets are efficient in reflecting new information.
On the other hand, a negative correlation may occur between cash prices and futures contracts when these markets exhibit divergent behavior. For example, if investors perceive that cash prices are undervalued, they may increase their demand for futures contracts, driving their prices up in relation to cash prices.
By analyzing the correlation between cash prices and futures contracts, market participants can detect potential arbitrage opportunities. Arbitrage involves taking advantage of price discrepancies between related assets to make risk-free profits. If the correlation between cash prices and futures contracts deviates significantly from its historical average, it may signal a potential opportunity for arbitrage.
Understanding the concept of correlation is crucial for conducting an in-depth analysis of cash prices and futures contracts. By examining the strength and direction of the relationship between these variables, market participants can make informed decisions and develop effective trading strategies.
The Importance of Correlation in Cash Prices and Futures Contracts
The correlation between cash prices and futures contracts plays a vital role in understanding the dynamics of financial markets. This correlation provides valuable insights that can guide investment strategies, risk management approaches, and market efficiency assessments.
One key importance of correlation analysis in cash prices and futures contracts is its ability to help investors and traders make informed decisions. By examining the historical correlation between these two variables, market participants can gain insights into the price movements of the underlying asset. For example, if there is a high positive correlation between cash prices and futures contracts, it suggests that changes in the cash market will likely be mirrored in the futures market. This information can help investors anticipate future price movements and adjust their positions accordingly.
Furthermore, correlation analysis can assist in managing risk exposure. By understanding the relationship between cash prices and futures contracts, investors can employ hedging strategies to mitigate potential losses. For instance, if an investor holds a long position in the cash market, they can hedge their risk by taking a short position in futures contracts. This way, any adverse price movements in the cash market can be offset by profits in the futures market, reducing overall risk.
Another significance of correlation analysis is its impact on assessing market efficiency. Market efficiency refers to how quickly and accurately prices adjust to new information. When the correlation between cash prices and futures contracts is high, it suggests that the market is efficient and effectively incorporating new information into price movements. On the other hand, a low or negative correlation may indicate market inefficiency, which could imply potential opportunities for traders to exploit price discrepancies.
In addition, correlation analysis can aid in evaluating the performance of trading strategies. By examining the correlation between cash prices and futures contracts over different time periods, traders can assess the effectiveness of their strategies. If the correlation aligns with the expected patterns, it indicates that the strategy is well-positioned to capitalize on market trends. Conversely, a divergence in correlation may signal the need to review and adjust the trading strategy.
Overall, understanding the correlation between cash prices and futures contracts is crucial for market participants looking to navigate the complexities of financial markets. It provides valuable insights into price movements, risk management, market efficiency, and trading strategy performance. By leveraging this information effectively, investors and traders can make more informed decisions and maximize their chances of success in the markets.
Methodology for Calculating Correlation
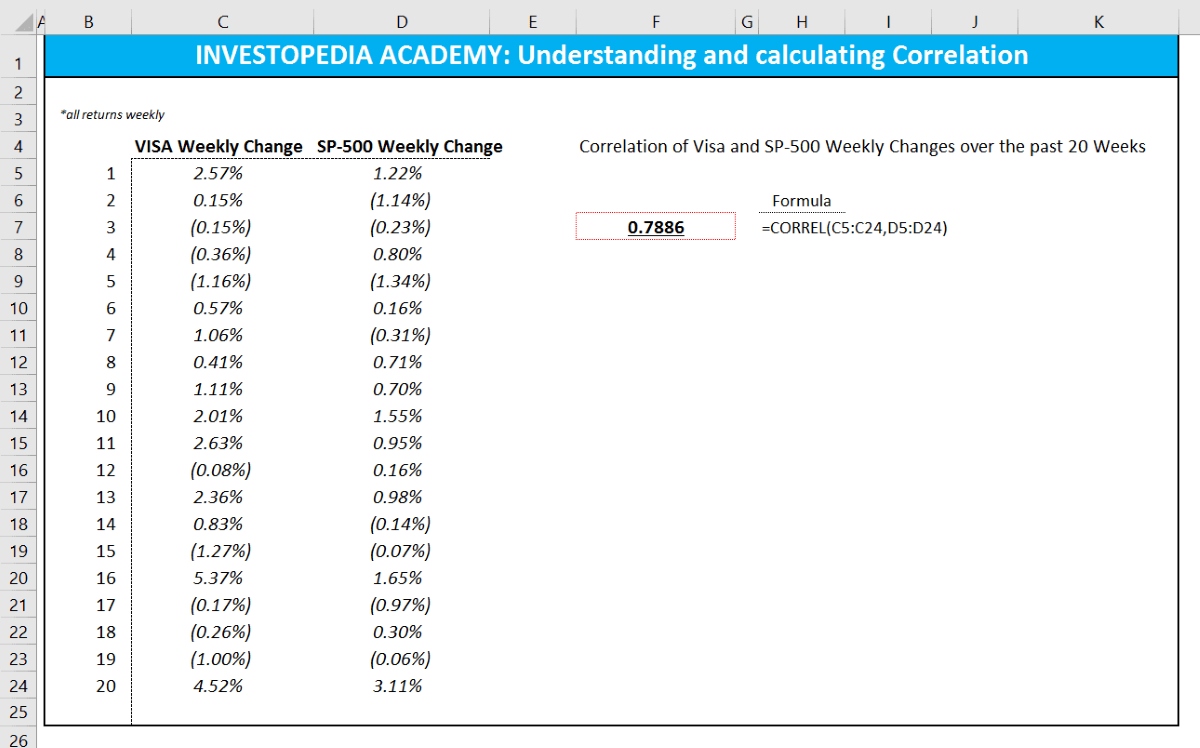
Calculating the correlation between cash prices and futures contracts involves a systematic approach that utilizes statistical calculations. The most commonly used method for calculating correlation is Pearson’s correlation coefficient, also known as Pearson’s r.
Pearson’s correlation coefficient measures the linear relationship between two variables, such as cash prices and corresponding futures contract prices. It is calculated by dividing the covariance of the two variables by the product of their standard deviations.
The formula for Pearson’s correlation coefficient is as follows:
r = (Σ[(x – x̄) * (y – ȳ)]) / (n * σx * σy)
Where:
- r is the correlation coefficient.
- Σ denotes the sum of the values.
- x and y are the individual data points.
- x̄ and ȳ are the means of x and y, respectively.
- n is the number of data points.
- σx and σy are the standard deviations of x and y, respectively.
The correlation coefficient, r, ranges between -1 and +1. A positive value indicates a positive linear relationship, while a negative value implies a negative linear relationship. A value close to 0 suggests little to no linear relationship between the variables.
Calculating the correlation between cash prices and futures contracts involves gathering historical data for both variables for the desired time period. Once the data is collected, the steps to calculate correlation are as follows:
- Compute the mean (average) for cash prices and futures contract prices.
- Calculate the deviation of each data point from the mean for both variables.
- Multiply the deviations for each pair of corresponding data points.
- Sum up the multiplied deviations.
- Divide the sum of the multiplied deviations by the product of the standard deviations of the two variables.
- The resulting value is the correlation coefficient (r).
It is worth noting that there are other methods available for calculating correlation, such as Spearman’s rank correlation coefficient and Kendall’s rank correlation coefficient, which are used when the relationship between variables is not linear. However, Pearson’s correlation coefficient is widely used for cash prices and futures contracts due to its simplicity and effectiveness in capturing linear associations.
By following the methodology outlined above, market participants can calculate the correlation coefficient between cash prices and futures contracts. This measurement provides valuable insights into the relationship between these variables and helps guide decision-making in financial markets.
Gathering Data for Cash Prices and Futures Contracts
When calculating the correlation between cash prices and futures contracts, it is crucial to gather accurate and reliable data for both variables. The quality of the data will directly impact the accuracy and effectiveness of the correlation analysis.
For cash prices, market participants can collect data from various sources, depending on the specific financial instrument or asset being analyzed. Some common sources include financial news websites, market data providers, government agencies, and financial exchanges. It is important to ensure that the cash price data is representative of the actual market prices at the specific time periods under consideration.
Futures contract data, on the other hand, can be obtained from designated exchanges where these contracts are traded. These exchanges provide historical data on futures contracts, including price and volume information. Traders and analysts can access this data either directly from the exchange or through data vendors who specialize in providing market data.
When gathering data, it is important to select a time frame that aligns with the objectives of the analysis. For short-term trading strategies, intraday or daily data might be sufficient. For longer-term analysis or portfolio management purposes, weekly or monthly data may be more appropriate.
In addition to selecting the correct time frame, it is crucial to ensure consistency in the data collected. This means that the cash prices and corresponding futures contract prices should reference the same asset or financial instrument. For example, if analyzing the correlation between cash prices for a particular stock and its corresponding futures contract, both datasets should pertain to the same stock.
It is also important to account for any adjustments or anomalies in the data. Corporate actions such as stock splits, dividends, or mergers can impact the cash prices and futures contract prices. These events should be factored in or adjusted to maintain the integrity of the data and avoid skewing the correlation results.
To assist in data collection and analysis, there are software tools and platforms available that provide historical price data. These tools often come equipped with features for organizing, filtering, and visualizing the data, making the correlation analysis more efficient and effective.
Overall, gathering accurate and reliable data for cash prices and futures contracts is a crucial step in calculating their correlation. Market participants should ensure that the data collected represents the specific financial instruments under analysis, that the time frame aligns with the objectives, and that any necessary adjustments or anomalies are accounted for. By adhering to these practices, the correlation analysis can be conducted with confidence and accuracy.
Step-by-Step Guide to Calculating Correlation
Calculating the correlation between cash prices and futures contracts involves a systematic process that can be broken down into several steps. By following these steps, market participants can accurately calculate the correlation coefficient and gain valuable insights into the relationship between these variables.
Step 1: Gather the data – Collect historical data for cash prices and corresponding futures contract prices for the desired time period. Ensure that the data is accurate and representative of the specific financial instruments under analysis.
Step 2: Organize the data – Arrange the cash prices and futures contract prices in separate columns or datasets. Ensure that the data aligns properly, with each data point corresponding to the same time period.
Step 3: Calculate the mean – Compute the mean (average) for both the cash prices and futures contract prices. This is done by summing up all the values for each dataset and dividing the sum by the total number of data points.
Step 4: Calculate the deviation – Calculate the deviation of each data point from the mean for both the cash prices and futures contract prices. This involves subtracting the mean from each individual data point.
Step 5: Multiply the deviations – Multiply the deviations of the cash prices and futures contract prices for each corresponding data point. This step is important for capturing the relationship between the two variables.
Step 6: Sum up the multiplied deviations – Add up all the multiplied deviations calculated in the previous step. This yields a single value that represents the sum of the products of the deviations.
Step 7: Calculate the standard deviation – Calculate the standard deviation for both the cash prices and futures contract prices. This involves finding the square root of the sum of the squared deviations from the mean.
Step 8: Calculate the correlation coefficient – Divide the sum of the multiplied deviations (Step 6) by the product of the standard deviations of the cash prices and futures contract prices (Step 7). This calculation yields the correlation coefficient.
Step 9: Interpret the correlation coefficient – Analyze the correlation coefficient to understand the relationship between the cash prices and futures contract prices. A positive value indicates a positive linear relationship, a negative value indicates a negative linear relationship, and a value close to zero suggests little to no linear relationship.
Step 10: Repeat and refine – It is beneficial to repeat the correlation calculation for different time periods or datasets to gain a more comprehensive understanding of the correlation between cash prices and futures contracts. Additionally, refining the methodology or adjusting the variables under analysis can provide further insights.
By following this step-by-step guide, market participants can accurately calculate the correlation coefficient between cash prices and futures contracts. This analysis provides valuable insights into the relationship between these variables and can guide investment decisions, risk management strategies, and trading approaches.
Interpretation of Correlation Results
Interpreting the correlation results between cash prices and futures contracts is essential for understanding the relationship between these variables and making informed decisions in the financial markets. The correlation coefficient provides valuable insights into the strength and direction of this relationship.
A correlation coefficient close to +1 indicates a strong positive linear relationship between cash prices and futures contracts. This means that as cash prices increase, futures contract prices tend to rise as well, and vice versa. A high positive correlation suggests that these two variables move closely together and are strongly influenced by each other.
On the other hand, a correlation coefficient close to -1 indicates a strong negative linear relationship. This means that as cash prices increase, futures contract prices tend to decrease, and vice versa. A high negative correlation suggests that the movement of cash prices is essentially mirrored by the movement of futures contract prices, but in the opposite direction.
A correlation coefficient close to 0 suggests a weak or no linear relationship between cash prices and futures contracts. In this case, changes in cash prices have little to no impact on futures contract prices, and the two variables exhibit independent movements.
It is important to emphasize that correlation does not imply causation. A high correlation between cash prices and futures contracts does not imply that one variable causes changes in the other. Instead, it indicates a consistent pattern of movement or association between the two variables.
Additionally, it is worth noting that correlation measures only linear relationships. It may not capture nonlinear associations or other types of relationships, such as lagged effects or complex interactions. Therefore, it is important to complement correlation analysis with other statistical methods and consider the context and dynamics of the financial markets under study.
Understanding the interpretation of correlation results can help market participants in various ways. For traders, it can guide decision-making by providing insights into the potential direction of price movements. A high positive correlation may indicate strong predictability, while a negative or weak correlation may suggest more uncertainty or divergent movements.
Investors and portfolio managers can also benefit from interpreting correlation results. By understanding the relationship between cash prices and futures contracts, they can assess the effectiveness of diversification strategies, risk management approaches, and asset allocation decisions. A low or negative correlation between certain assets may indicate potential diversification benefits, as they may move in opposite directions during market turbulence.
Overall, interpreting the correlation results between cash prices and futures contracts enables market participants to gain insights into the relationship between these variables. It guides decision-making, risk management, and portfolio construction, ultimately contributing to more informed and effective strategies in the financial markets.
Limitations and Considerations in Calculating Correlation
While correlation analysis provides valuable insights into the relationship between cash prices and futures contracts, it is essential to be aware of its limitations and consider certain factors when interpreting the correlation results. These limitations and considerations can impact the accuracy and relevance of the correlation analysis.
Firstly, correlation measures only the linear relationship between variables. It may not capture nonlinear associations, lagged effects, or other complex interactions. Therefore, it is important to complement correlation analysis with other statistical methods and consider the specific dynamics of the financial markets under study.
Secondly, correlation analysis assumes a consistent and stable relationship between variables over time. However, market dynamics can change, and correlations can vary. It is important to regularly revisit and update the correlation analysis to account for changing market conditions and incorporate fresher data.
Another consideration is that correlation only measures the strength and direction of the linear relationship between variables, and it does not provide information about the causality or underlying factors. It is crucial to avoid making assumptions about causation based solely on correlation analysis.
Additionally, outliers can significantly impact the correlation coefficient. Outliers are data points that deviate significantly from the overall pattern of the data. These extreme values can skew the correlation results and distort the interpretation. It is important to identify and handle outliers appropriately, either by removing them from the analysis or incorporating statistical techniques that account for their impact.
Moreover, it is important to note that correlation does not capture all aspects of the relationship between cash prices and futures contracts. Other factors such as transaction costs, liquidity differences, market microstructure, and regulatory considerations can influence the behavior of these variables. These factors should be considered alongside correlation analysis to gain a comprehensive understanding of the relationship.
Lastly, correlation is a historical measure that describes the relationship between variables based on past data. Future correlations may differ, and it is important to exercise caution when using historical correlation to make predictions or guide investment decisions.
Considering these limitations and factors is crucial in conducting accurate and meaningful correlation analysis between cash prices and futures contracts. By acknowledging these constraints and interpreting the results in a holistic manner, market participants can make more informed decisions and effectively utilize correlation analysis in their financial strategies.
Real-World Applications of Correlation Analysis in Cash Prices and Futures Contracts
Correlation analysis between cash prices and futures contracts has several real-world applications that can assist investors, traders, and financial analysts in making informed decisions and managing risks. These applications span across various investment strategies, risk management techniques, and market assessments.
One key application is in portfolio diversification. Correlation analysis helps identify assets or financial instruments with low or negative correlations. By including such assets in a portfolio, investors can potentially reduce risk through diversification. For example, if cash prices of certain stocks have a low correlation with the corresponding futures contracts, adding these contracts to a portfolio may provide a hedging or diversification benefit.
Furthermore, correlation analysis plays a crucial role in risk management. By examining the correlation between cash prices and futures contracts, market participants can assess the effectiveness of hedging strategies. For instance, if the correlation between cash prices and futures contracts is consistently high, a trader can utilize futures contracts to hedge their positions in the cash market. This helps mitigate the impact of adverse price movements and provides a level of protection against potential losses.
Correlation analysis is also valuable in identifying potential arbitrage opportunities. Arbitrageurs look for price discrepancies between cash prices and futures contracts to make risk-free profits. By monitoring the correlation between these variables, traders can identify situations where the correlation deviates significantly from its historical average, potentially indicating mispriced assets or temporary market inefficiencies.
Moreover, correlation analysis aids in assessing market efficiency. A high positive correlation between cash prices and futures contracts suggests that the markets are efficiently reflecting new information and price changes. This information can be valuable for market participants, as it indicates that prices in the cash market are accurately and swiftly reflected in the futures market.
Correlation analysis also has applications in trading strategies. By studying the historical correlation between cash prices and futures contracts, traders can refine their strategies and adapt to changing market conditions. For instance, if the correlation between these two variables demonstrates a consistent pattern, traders can incorporate this knowledge into their decision-making process, potentially improving their chances of successful trades.
Additionally, correlation analysis is used in pairs trading strategies. Pairs trading involves taking long and short positions in two related assets with a historically high correlation. By monitoring the correlation between cash prices and futures contracts of these assets, traders can identify potential opportunities to profit from the convergence or divergence of their prices.
Overall, correlation analysis between cash prices and futures contracts has numerous real-world applications. It assists in portfolio diversification, risk management, identifying arbitrage opportunities, assessing market efficiency, refining trading strategies, and implementing pairs trading strategies. By leveraging this analysis, market participants can enhance their decision-making process and navigate the financial markets with more confidence and effectiveness.
Conclusion
Understanding the correlation between cash prices and futures contracts is fundamental for navigating the complexities of the financial markets. Correlation analysis provides valuable insights into the relationship between these variables, guiding investment decisions, risk management strategies, and market assessments.
By calculating the correlation coefficient using statistical methods such as Pearson’s correlation coefficient, market participants can quantify the strength and direction of the linear relationship between cash prices and futures contracts.
The interpretation of correlation results plays a crucial role in decision-making. A high positive correlation indicates a strong relationship, while a negative or weak correlation suggests independence or divergence. However, it is important to remember that correlation does not imply causation, and other factors may influence the relationship between these variables.
While correlation analysis has its limitations and considerations, such as its linear nature, sensitivity to outliers, and dependence on historical data, it remains highly useful in practice.
Real-world applications of correlation analysis in cash prices and futures contracts include portfolio diversification, risk management, identifying arbitrage opportunities, assessing market efficiency, refining trading strategies, and implementing pairs trading strategies.
In conclusion, correlation analysis between cash prices and futures contracts provides market participants with valuable insights into the relationship between these variables. By leveraging this analysis, investors, traders, and financial analysts can make more informed decisions and navigate the financial markets with greater confidence and effectiveness.
What's Hot
Latest Articles
Related Post


By: • Finance

By: • Finance
By: • Finance
By: • Finance

By: • Finance

By: • Finance
By: • Finance


By: • Finance

By: • Finance

By: • Finance

By: • Finance