Home>Finance>How To Find Average Total Assets On Balance Sheet
Finance
How To Find Average Total Assets On Balance Sheet
Modified: December 30, 2023
Learn how to find the average total assets on a balance sheet in finance. Master the calculation to gain valuable insights and make informed decisions.
(Many of the links in this article redirect to a specific reviewed product. Your purchase of these products through affiliate links helps to generate commission for LiveWell, at no extra cost. Learn more)
Table of Contents
Introduction
When analyzing the financial health and performance of a company, one crucial aspect to consider is its balance sheet. The balance sheet provides a snapshot of a company’s financial position at a specific point in time, showcasing its assets, liabilities, and equity. Among the various components of the balance sheet, the total assets figure holds significant importance. It represents the aggregate value of the resources owned by a company, which can include cash, inventory, property, plant, equipment, investments, and more.
However, assessing a company’s financial position solely based on its total assets at a single point in time may not provide a complete picture. This is where the concept of average total assets comes into play. By calculating the average total assets, analysts and investors can gain insights into the company’s performance over a certain period.
In this article, we will delve deeper into the importance of average total assets on the balance sheet and guide you through the process of finding and calculating this metric.
What are Total Assets?
Total assets are a key component of a company’s balance sheet and represent the cumulative value of all the resources owned by the company. These resources can include a wide range of tangible and intangible assets that contribute to the company’s operations and future potential.
Tangible assets are the physical assets that have a physical existence, such as cash, inventory, property, and equipment. Cash represents the amount of money and cash equivalents that a company has on hand or in its bank accounts. Inventory includes the products or goods that the company holds for sale or intends to use in its production process. Property and equipment encompass the land, buildings, machinery, vehicles, and other assets that are used in the company’s operations.
Intangible assets, on the other hand, do not have a physical presence but hold value for the company. These can include intellectual property, patents, trademarks, copyrights, brand value, and customer lists. Intangible assets often contribute significantly to a company’s competitive advantage and market value.
The total assets figure on the balance sheet is a summation of both tangible and intangible assets and helps evaluate the overall financial strength and resource base of a company. It not only provides insights into the value of the company’s assets but also serves as a foundation for other key financial ratios and calculations.
Understanding the composition and value of a company’s total assets is essential for investors, lenders, and financial analysts as it helps assess the company’s capacity to generate income, manage its liabilities, and support future growth. By analyzing the trends in total assets over time, stakeholders can gain insights into the company’s financial health, investment decisions, and overall business strategy.
Why is Average Total Assets Important?
The concept of average total assets is crucial for assessing a company’s financial performance over a specific period. Instead of relying solely on the total assets figure at a single point in time, calculating the average total assets provides a more accurate representation of the company’s asset utilization and productivity.
Here are a few reasons why average total assets is important:
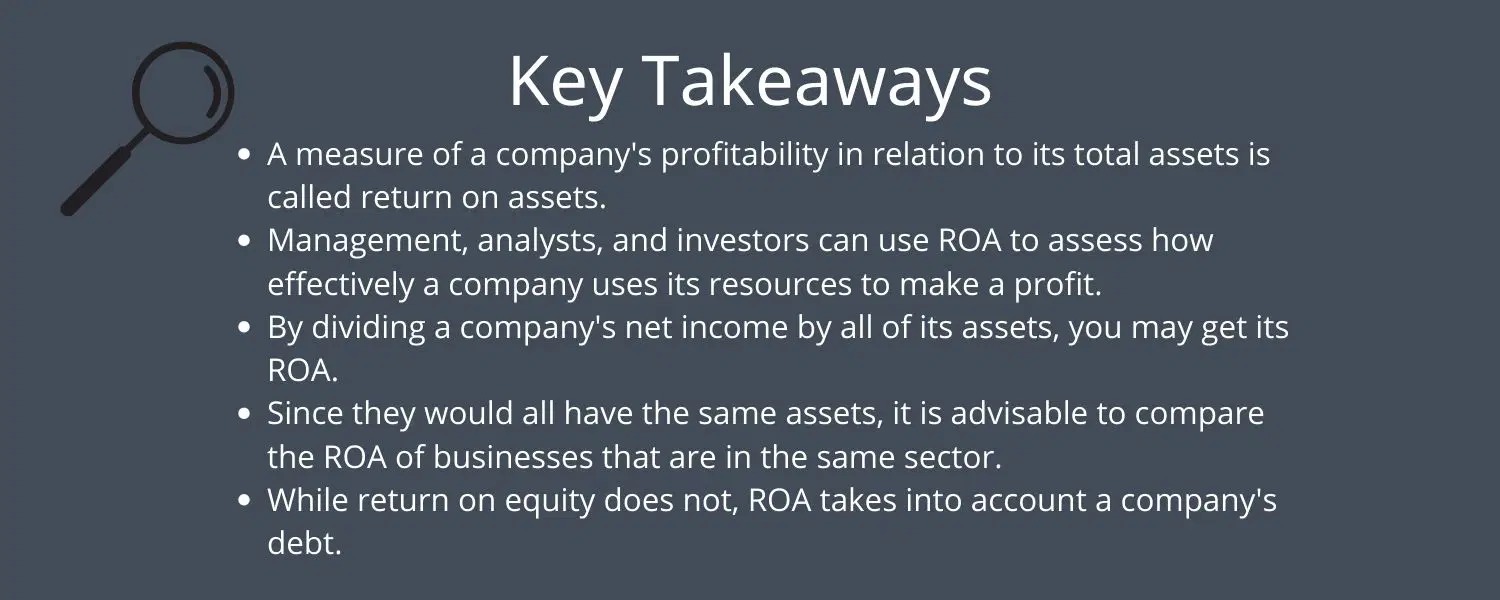
- Performance Measurement: Average total assets are used to calculate important financial ratios such as Return on Assets (ROA). ROA indicates the company’s ability to generate profits from its invested assets. By comparing the company’s net income to its average total assets, investors and analysts can assess how efficiently the company is utilizing its assets to generate earnings.
- Trend Analysis: Analyzing the trend of average total assets over multiple periods provides valuable insights into a company’s growth and development. If the average total assets are consistently increasing, it suggests that the company is expanding its operations and investing in new assets. Conversely, a declining trend may indicate asset divestment or inefficient asset utilization.
- Business Valuation: Average total assets play a vital role in determining the value of a company. When valuing a business using methods like the Price-to-Asset Ratio, the average total assets provide a more accurate representation of the company’s asset base compared to using the total assets figure at a single point in time.
- Benchmarking: Average total assets allow for meaningful comparisons between companies within the same industry. By comparing the average total assets of different companies, investors and analysts can assess how effectively each company is utilizing its assets relative to its competitors.
- Investment Decisions: When making investment decisions, average total assets provide valuable information about a company’s ability to generate future cash flows and support growth. Higher average total assets may indicate a stronger foundation and better prospects for future profitability.
By considering the average total assets rather than just the total assets at a particular point in time, stakeholders can gain a more comprehensive understanding of a company’s asset utilization, profitability, and growth potential. It helps in making more informed investment decisions and evaluating a company’s overall financial health in a more accurate manner.
Understanding the Balance Sheet
The balance sheet is one of the three main financial statements used to assess the financial position of a company, alongside the income statement and cash flow statement. It provides an overview of a company’s assets, liabilities, and shareholders’ equity at a specific point in time.
The balance sheet is based on the fundamental accounting equation, which states that assets must equal liabilities plus shareholders’ equity. This equation ensures that the balance sheet remains balanced and reflects the company’s financial position accurately.
The balance sheet is divided into two main sections: assets and liabilities. The assets section lists all the resources that the company owns, while the liabilities section shows the company’s obligations to creditors and shareholders.
Assets are further categorized into current assets and non-current assets. Current assets are those that are expected to be converted into cash or used up within one year and include cash, accounts receivable, inventory, and short-term investments. Non-current assets, on the other hand, are long-term assets that are not expected to be converted into cash within one year and include property, plant, equipment, and intangible assets.
Liabilities are categorized as current liabilities and non-current liabilities. Current liabilities are the obligations that are expected to be settled within one year and include accounts payable, short-term loans, and accrued expenses. Non-current liabilities, also known as long-term liabilities, are the obligations that are not expected to be settled within one year and include long-term loans, deferred taxes, and pension liabilities.
The balance sheet also includes shareholders’ equity, which represents the residual interest in the assets of the company after deducting liabilities. Shareholders’ equity includes the company’s share capital, retained earnings, and any additional paid-in capital. It reflects the ownership interest of the shareholders in the company.
By analyzing the balance sheet, investors and analysts can gain insights into a company’s financial strength, liquidity, solvency, and overall risk profile. It helps them understand the company’s ability to meet its short-term and long-term obligations, assess its asset composition and capital structure, and evaluate its overall financial health.
Calculation of Average Total Assets
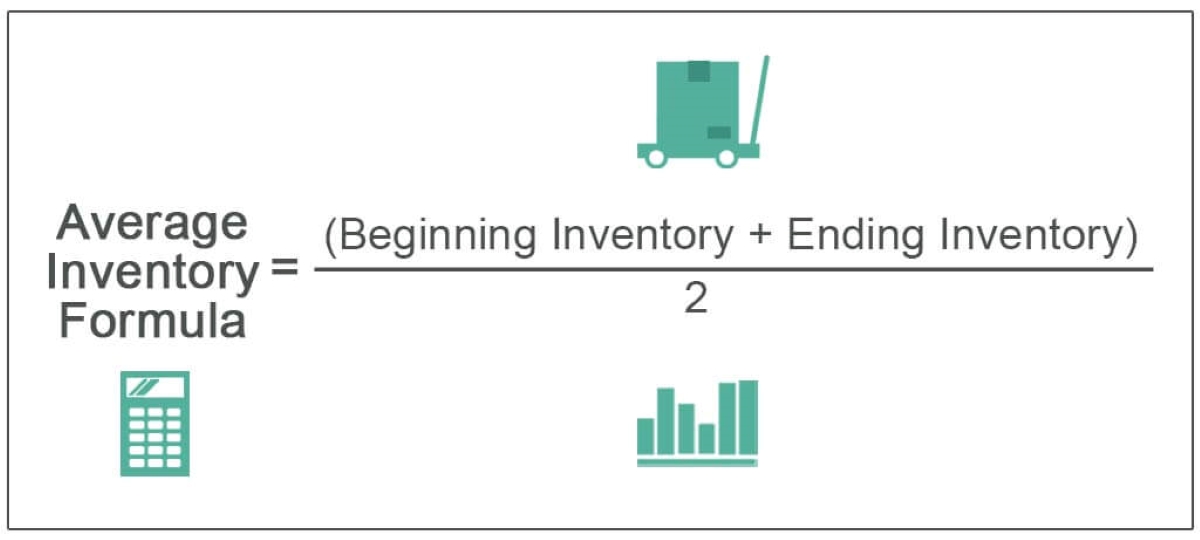
Calculating the average total assets involves determining the average value of a company’s total assets over a specific period of time. This allows for a deeper understanding of a company’s asset utilization and provides a more accurate representation of its financial performance. The calculation can be done using the following formula:
Average Total Assets = (Total Assets at the Beginning of the Period + Total Assets at the End of the Period) / 2
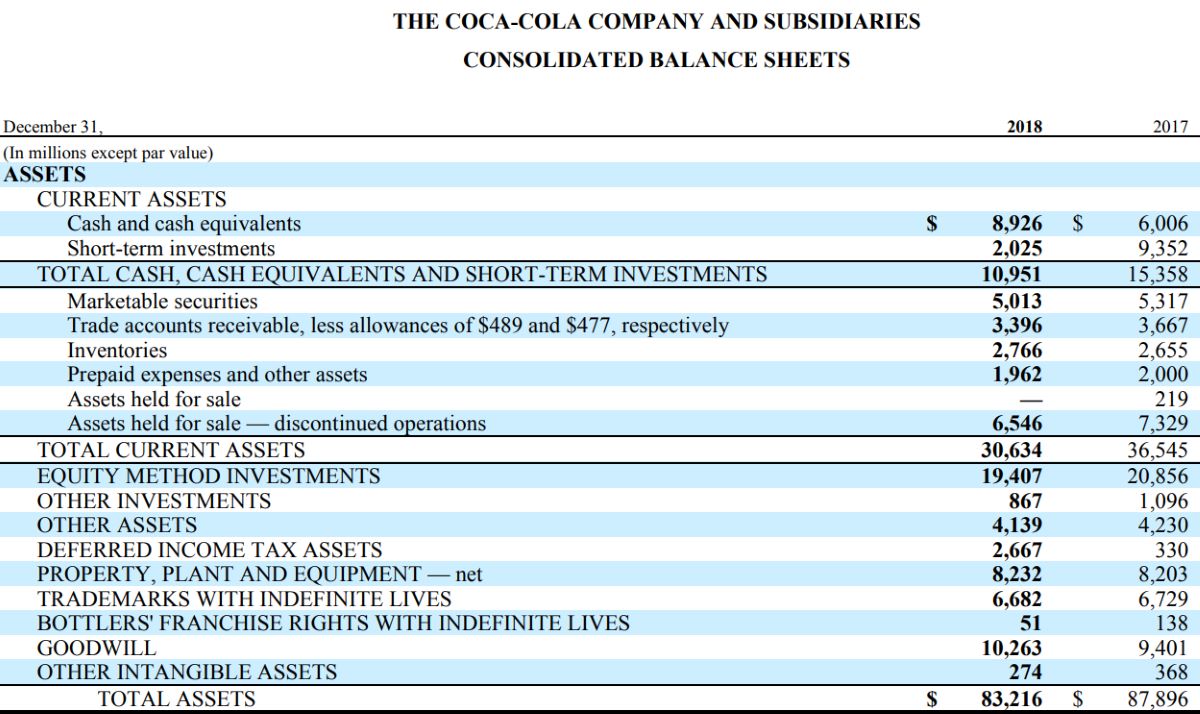
To calculate the average total assets, you need to have the balance sheets for the beginning and end of the selected period. The total assets figures can be found on the balance sheet under the assets section.
Let’s consider an example to illustrate the calculation:
Company XYZ has the following total assets figures:
- Beginning of the Year: $500,000
- End of the Year: $700,000
To find the average total assets, we will use the formula:
Average Total Assets = ($500,000 + $700,000) / 2 = $600,000
In this example, the average total assets of Company XYZ over the selected period is $600,000.
The calculated average total assets figure provides a more accurate representation of the company’s asset base and can be used in various financial performance ratios and analysis. It helps in evaluating the company’s ability to generate profits from its invested assets, comparing against industry benchmarks, and understanding the company’s overall asset utilization efficiency.
It is important to note that the length of the selected period for calculating average total assets may vary depending on the analyst’s preferences or the specific requirements of the analysis. It can be calculated on an annual, quarterly, or any other desired basis.
Steps to Find Average Total Assets on Balance Sheet
To find the average total assets on a balance sheet, you can follow the steps outlined below:
- Gather the balance sheets: Collect the balance sheets for the desired period. Typically, you will need the balance sheet for the beginning and end of the period.
- Locate the total assets: On each balance sheet, locate the total assets figure. This can usually be found on the assets section of the balance sheet.
- Sum the total assets: Add up the total assets from the beginning and end of the period.
- Divide by 2: Take the sum of the total assets and divide it by 2 to calculate the average.
Let’s go through an example to illustrate the steps:
Company ABC has the following total assets figures:
- Beginning of the Year: $1,000,000
- End of the Year: $1,500,000
To find the average total assets, follow the steps:
- Gather the balance sheets: Obtain the balance sheet for the beginning and end of the year.
- Locate the total assets: Find the total assets figure on each balance sheet.
- Sum the total assets: Add the total assets figures together: $1,000,000 + $1,500,000 = $2,500,000
- Divide by 2: Divide the sum of total assets by 2: $2,500,000 / 2 = $1,250,000
In this example, the average total assets of Company ABC over the selected period is $1,250,000.
By following these steps, you can calculate the average total assets on a balance sheet. This metric provides a better representation of a company’s overall asset utilization and can be used in financial analysis to assess performance and make informed investment decisions.
Example Calculation
To illustrate the calculation of average total assets on a balance sheet, let’s consider an example using Company XYZ.
Company XYZ has the following total assets figures:
- Balance Sheet at the Beginning of the Year: $500,000
- Balance Sheet at the End of the Year: $700,000
To calculate the average total assets, follow these steps:
- Sum the total assets: Add the total assets figures together: $500,000 + $700,000 = $1,200,000
- Divide by 2: Divide the sum of total assets by 2: $1,200,000 / 2 = $600,000
In this example, the average total assets of Company XYZ over the selected period is $600,000.
The calculation of average total assets allows for a more accurate representation of a company’s financial performance and asset utilization. By taking the average value over a specific period, it smooths out any fluctuations and provides a more stable measure for analysis and decision-making.
This information is valuable for investors, analysts, and other stakeholders who are assessing the company’s financial health, profitability, and asset management techniques. It provides insights into how effectively the company is utilizing its assets to generate profits and supports comparisons with industry benchmarks and peers.
By calculating the average total assets, stakeholders can gain a better understanding of a company’s financial performance and make more informed investment decisions.
Limitations and Considerations
While calculating the average total assets on a balance sheet provides valuable insights, it’s important to be aware of certain limitations and considerations:
- Short-term versus long-term assets: The average total assets calculation may not differentiate between short-term and long-term assets. It assumes that the value of assets remains relatively constant throughout the selected period.
- Fluctuating assets: If a company’s total assets fluctuate significantly during the selected period, using the average may not accurately reflect the company’s asset utilization and productivity. In such cases, it is advisable to consider other metrics or calculations that account for these fluctuations.
- Non-linear changes: The average total assets calculation assumes a linear change in asset values over time. However, if there are non-linear changes or significant fluctuations in asset values, it may be more appropriate to use other methods of analysis or consider a different time frame.
- Different reporting periods: The average total assets calculation is typically based on a specific reporting period, such as a year or a quarter. It may not capture changes in asset values that occur outside of this period.
- Industry-specific considerations: Different industries may have varying asset structures and utilization patterns. It is important to consider these industry-specific factors when interpreting the average total assets figure and comparing it across companies or sectors.
- Financial statement quality: The accuracy of the average total assets calculation relies on the quality and reliability of the balance sheet data. If there are errors or inconsistencies in the financial statements, it can impact the accuracy of the calculated average.
- Contextual interpretation: The average total assets figure should not be viewed in isolation. It is essential to consider other financial ratios, industry benchmarks, and qualitative factors to gain a comprehensive understanding of a company’s financial performance and asset utilization.
Considering these limitations and considerations alongside the average total assets calculation can help provide a more nuanced and informed assessment of a company’s financial health and asset management practices. It is important to use the average total assets figure as one component of a broader analysis, taking into account the specific context and industry dynamics.
Conclusion
The calculation and analysis of average total assets on a balance sheet is a valuable tool for evaluating a company’s financial performance, asset utilization, and overall financial health over a specific period. By taking the average value of total assets, rather than relying solely on a single point in time, stakeholders can gain a more accurate representation of the company’s asset base and its ability to generate profits.
Average total assets serve as a foundation for important financial metrics such as Return on Assets (ROA), and can be used to compare a company’s performance against industry benchmarks and competitors. It provides insights into trends, growth patterns, and efficiency in asset management.
When calculating the average total assets, it is important to be mindful of limitations and considerations. Fluctuations in asset values, different reporting periods, and industry-specific factors should be taken into account to ensure accurate interpretation and analysis of the average total assets figure.
Overall, average total assets on a balance sheet offer a valuable tool for investors, analysts, and stakeholders in assessing a company’s financial performance and making informed investment decisions. By understanding the composition and trends in average total assets, stakeholders can gain deeper insights into a company’s asset utilization, profitability, and sustainable growth potential.
Therefore, incorporating the calculation of average total assets into financial analysis and decision-making processes can enhance the understanding of a company’s financial position and contribute to more informed and effective strategic planning and investment choices.
What's Hot
Latest Articles
Related Post

By: • Finance
By: • Finance

By: • Finance

By: • Finance

By: • Finance

By: • Finance
By: • Finance

By: • Finance
By: • Finance
By: • Finance

By: • Finance

By: • Finance


By: • Finance

By: • Finance