
Finance
How To Calculate Inventory On Balance Sheet
Modified: December 30, 2023
Learn how to calculate inventory on the balance sheet and gain a better understanding of finance.
(Many of the links in this article redirect to a specific reviewed product. Your purchase of these products through affiliate links helps to generate commission for LiveWell, at no extra cost. Learn more)
Table of Contents
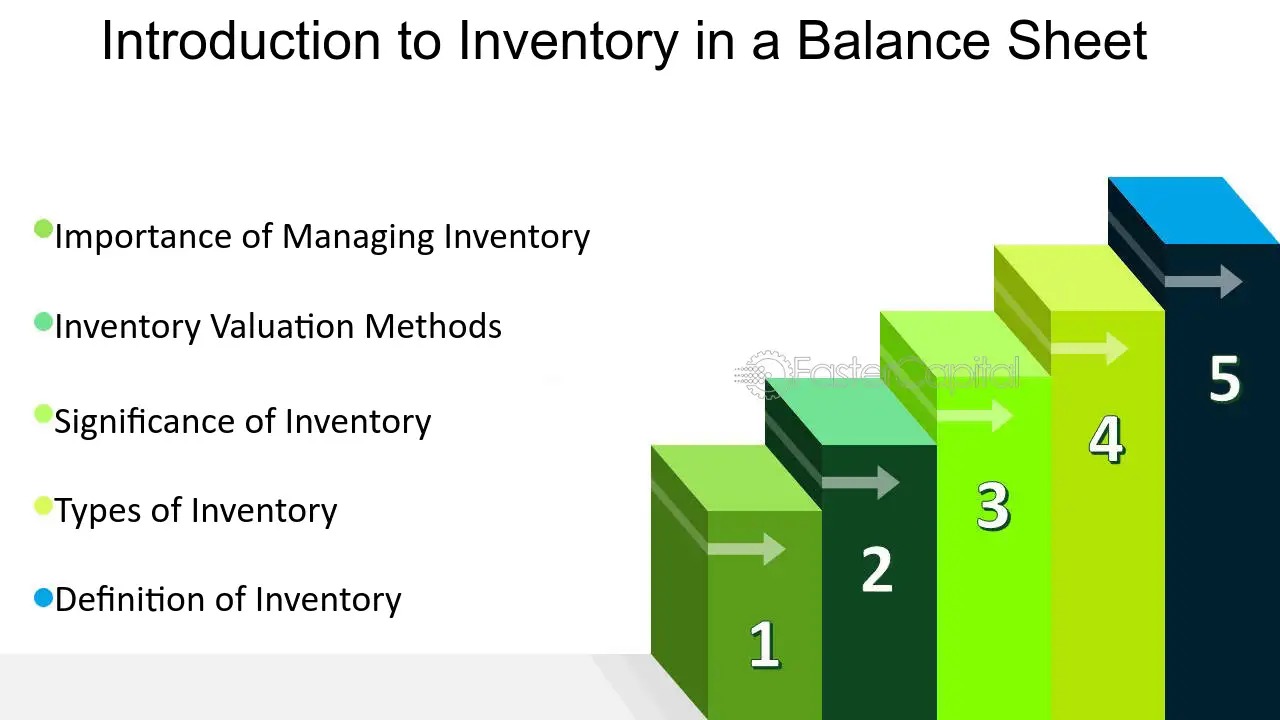
- Introduction
- Understanding Inventory on Balance Sheets
- Types of Inventory
- Inventory Valuation Methods
- FIFO Method (First-In, First-Out)
- LIFO Method (Last-In, First-Out)
- Weighted Average Cost Method
- Specific Identification Method
- Calculating Inventory on Balance Sheet
- Step 1: Determine the Cost of Goods Sold (COGS)
- Step 2: Calculate the Ending Inventory
- Step 3: Calculate the Inventory Turnover Ratio
- Step 4: Calculate the Days Inventory Outstanding (DIO)
- Analyzing Inventory on Balance Sheets
- Benefits of Accurate Inventory Calculation
- Conclusion
Introduction
Welcome to our comprehensive guide on how to calculate inventory on balance sheets. As an essential component of financial reporting, understanding how to accurately calculate inventory is crucial for businesses in all industries. Inventory refers to the goods or products that a company holds for sale, including raw materials, work-in-progress, and finished goods. It plays a significant role in determining a company’s profitability, cash flow, and overall financial health.
Inventory is a crucial asset for businesses, as it represents the value of products that are available for sale to customers. Efficient management of inventory is essential to ensure that a company maintains optimal levels of stock, minimizing the risk of stockouts or overstocking. Additionally, proper inventory management aids in ensuring that a company can fulfill customer orders promptly and effectively, leading to improved customer satisfaction and repeat business.
Calculating inventory on the balance sheet involves determining the cost of goods sold (COGS) and the value of inventory at the end of a specified accounting period. This information helps businesses assess their inventory turnover ratio and the days inventory outstanding (DIO), which provide insights into how effectively they are managing their inventory.
In this guide, we will explore the various types of inventory, inventory valuation methods, and step-by-step instructions on how to calculate inventory on the balance sheet. We will also discuss the significance of accurate inventory calculation and how it impacts a company’s financial performance.
Whether you are a business owner, investor, or finance professional, understanding how to calculate inventory on balance sheets is essential for making informed decisions and managing the financial aspects of a company. So, let’s dive in and explore the fascinating world of inventory management and its impact on financial reporting!
Understanding Inventory on Balance Sheets
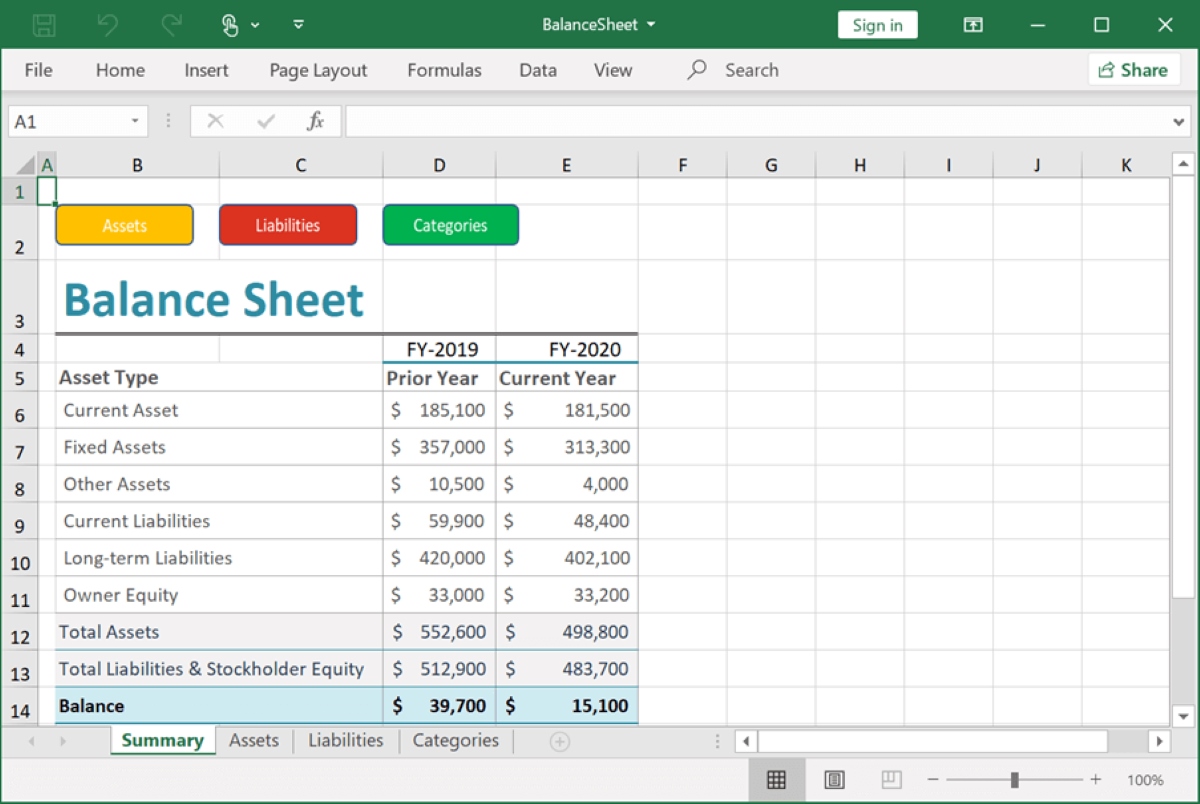
Before delving into the process of calculating inventory on balance sheets, it’s important to have a solid understanding of what inventory represents in a company’s financial statements. Inventory is an asset that reflects the value of goods held by a business for sale, production, or conversion into finished products.
Inventory is categorized into three main types: raw materials, work-in-progress, and finished goods. Raw materials are the basic materials that are used in the production of goods. Work-in-progress inventory includes partially completed products that are still in the manufacturing process. Finished goods inventory comprises the final products that are ready for sale to customers.
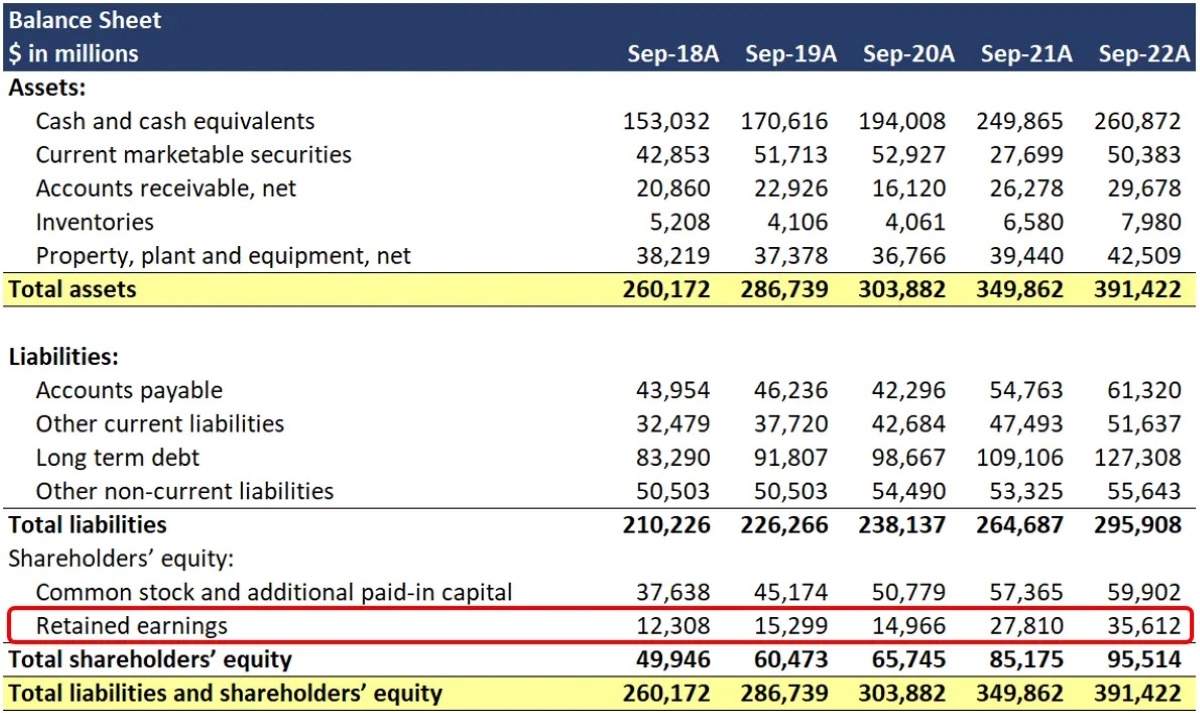
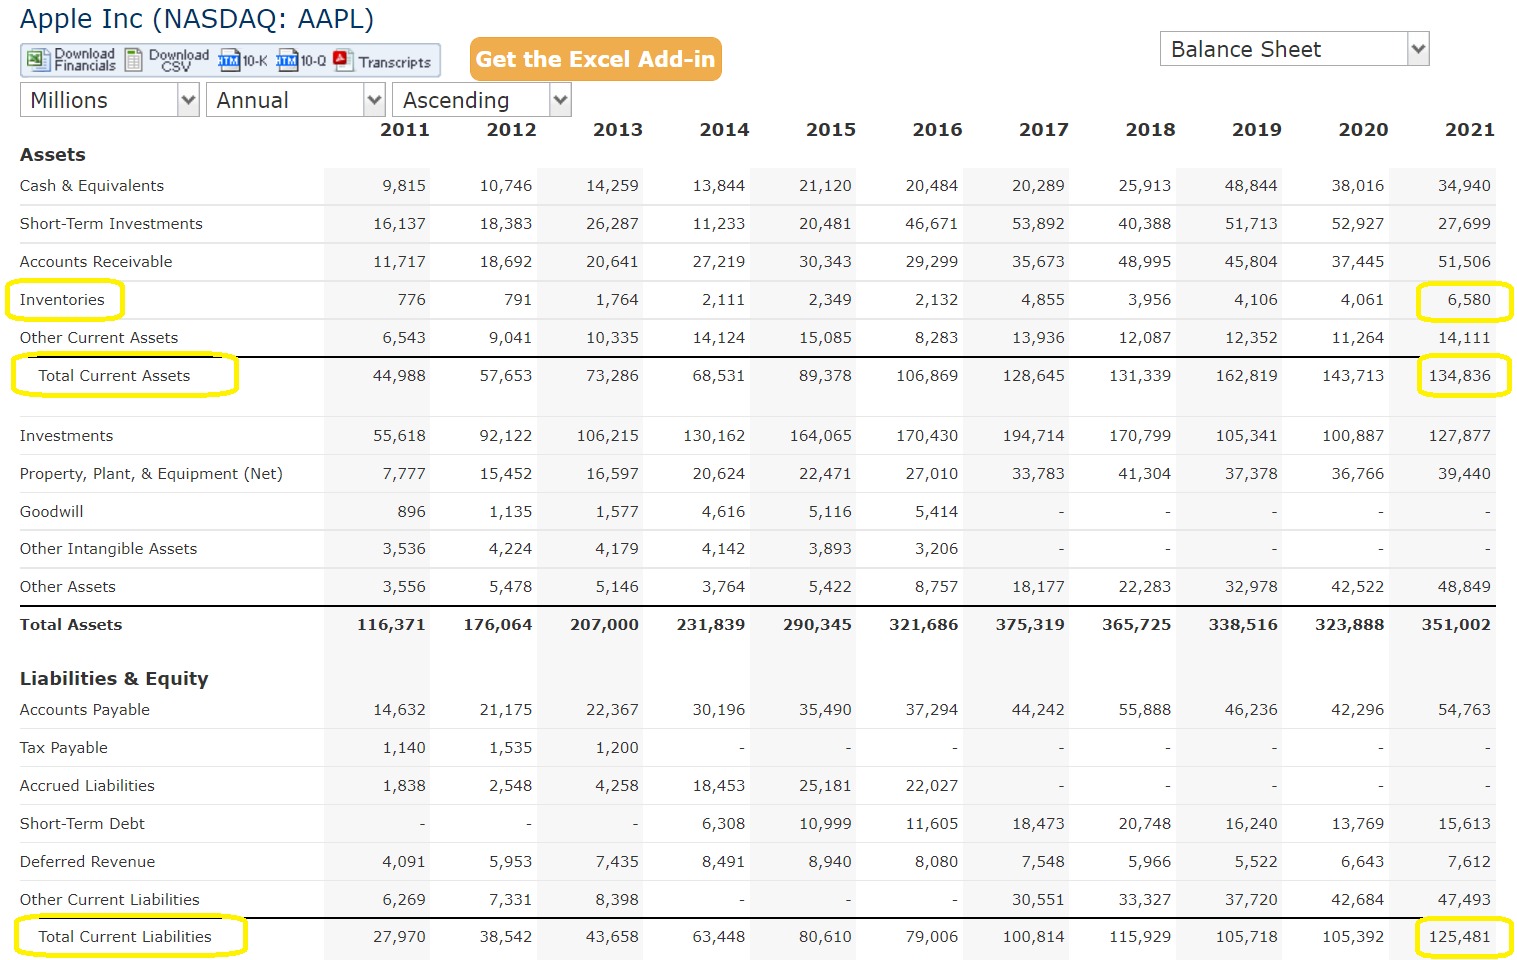
Inventory on balance sheets is reported as a current asset, as it is expected to be converted into cash or sold within one year or the operating cycle of the business, whichever is longer. It is represented on the balance sheet at either its cost or its net realizable value, whichever is lower.
The cost of inventory includes all expenses incurred to acquire or produce the goods, such as purchase costs, direct labor costs, and overhead costs. It does not include unrelated costs like shipping or selling expenses. Net realizable value, on the other hand, represents the estimated selling price of the inventory, less any estimated costs to complete and sell the goods.
Inventory turnover is a key ratio that measures how efficiently a company manages its inventory. It is calculated by dividing the cost of goods sold (COGS) by the average inventory value. A high inventory turnover ratio indicates that a company is converting its inventory into sales quickly, while a low ratio may suggest inadequate sales or overstocking.
The days inventory outstanding (DIO) is a measure of the average number of days it takes for a company to sell its inventory. It is calculated by dividing the average inventory value by the daily cost of goods sold. A lower DIO indicates faster inventory turnover and better inventory management.
Understanding the importance of inventory on balance sheets and the calculations associated with it is essential for businesses to effectively manage their inventory levels, optimize cash flow, and make informed financial decisions. In the following sections, we will explore different inventory valuation methods and the step-by-step process of calculating inventory on the balance sheet.
Types of Inventory
Inventory is a crucial component of a company’s assets, representing the value of products available for sale or use in the production process. There are several types of inventory that businesses may hold depending on their industry and operations:
1. Raw Materials:
Raw materials are the basic components used in the manufacturing process to create finished products. They can include items such as metal, wood, chemicals, or fabrics, depending on the nature of the business. Raw materials inventory is crucial for industries like manufacturing, construction, and apparel, where these materials are transformed into finished goods.
2. Work-in-Progress (WIP):
Work-in-progress inventory consists of products that are still being manufactured or assembled but are not yet completed. This inventory stage is common in industries where production involves multiple stages or processes. WIP includes partially finished goods, such as partially assembled electronics or half-completed vehicles. It represents the value of materials invested in the manufacturing process until the products are ready for sale.
3. Finished Goods:
Finished goods are the end products that are ready to be sold to customers. They have completed the entire production process and are packaged and labeled for sale. Examples of finished goods inventory include cars in an automobile manufacturing company, electronic appliances in an electronics store, or packaged food items in a grocery store. This type of inventory represents the final stage of production before the products are delivered to customers.
4. Maintenance, Repair, and Operations (MRO) Inventory:
MRO inventory consists of items necessary for the day-to-day operations of a business. These items are not directly incorporated into the final product but are essential for supporting production or maintaining the company’s facilities and equipment. MRO inventory includes things like spare parts, tools, lubricants, cleaning supplies, and safety equipment. Proper management of MRO inventory is crucial to ensure smooth operations and minimize downtime.
5. Consignment Inventory:
Consignment inventory is inventory that is held by a company but still owned by the supplier or manufacturer. In this arrangement, the supplier retains ownership of the goods until they are sold by the company. Consignment inventory is often seen in retail businesses, where the retailer only pays for the inventory when it is sold and returns any unsold items to the supplier.
Each type of inventory has its own characteristics and management requirements. Understanding the different types of inventory a business might hold is essential for effective inventory management and financial planning. In the next section, we will explore various inventory valuation methods that businesses use to determine the value of their inventory on the balance sheet.
Inventory Valuation Methods
Inventory valuation is the process of assigning a value to the inventory held by a company. There are several methods used to determine the value of inventory, with each method having its own advantages and considerations. Here are some commonly used inventory valuation methods:
1. FIFO Method (First-In, First-Out):
The FIFO method assumes that the first inventory items purchased or produced are the first ones sold. In other words, the cost of the oldest inventory is matched with the revenue from sales, while the cost of the most recently acquired inventory is assigned to the ending inventory. This method can be beneficial when inventory costs are rising over time, as it results in a lower cost of goods sold and higher ending inventory value.
2. LIFO Method (Last-In, First-Out):
The LIFO method assumes that the most recently acquired or produced inventory items are the first ones sold. This means that the cost of the most recent inventory purchases is matched with the revenue from sales, while the cost of older inventory is assigned to the ending inventory. LIFO is often used to minimize taxable income by assigning higher costs to goods sold and lower costs to ending inventory. However, it may not accurately reflect the actual flow of goods in some industries.
3. Weighted Average Cost Method:
The weighted average cost method calculates the average cost of all units available for sale during a given period. It considers both the cost of beginning inventory and the cost of additional units purchased or produced during the period. The average cost per unit is then multiplied by the number of units in ending inventory to determine the value of inventory on the balance sheet. This method provides a more stable and consistent valuation, as it smooths out the fluctuations in inventory costs.
4. Specific Identification Method:
The specific identification method involves individually tracking the cost of each item of inventory. This method is commonly used for unique, high-value items such as artwork, jewelry, or custom-built products. By assigning the exact cost of each item to the corresponding revenue, the specific identification method provides the most accurate representation of the inventory’s value on the balance sheet.
It’s important to note that the choice of inventory valuation method can have significant implications for a company’s financial statements and tax liabilities. Different methods can result in varying values of cost of goods sold, gross profit, and net income. Therefore, it’s crucial for businesses to carefully consider their industry, inventory characteristics, and financial objectives when selecting an appropriate inventory valuation method.
Now that we’ve explored the different inventory valuation methods, let’s move on to the step-by-step process of calculating inventory on the balance sheet.
FIFO Method (First-In, First-Out)
The FIFO method is one of the most commonly used inventory valuation methods. It assumes that the first inventory items purchased or produced are the first ones sold. This means that the cost of the oldest inventory is matched with the revenue from sales, while the cost of the most recently acquired inventory is assigned to the ending inventory. The term “first-in, first-out” accurately describes the flow of goods, as items that are received first are also assumed to be sold first.
Here’s an example to illustrate how the FIFO method works:
Let’s assume that a clothing retailer purchases 100 t-shirts at a cost of $10 each on January 1st, and then purchases 200 more t-shirts at a cost of $12 each on February 1st. During the month of February, the retailer sells 150 t-shirts. Under the FIFO method, the cost of the 100 t-shirts purchased in January would be matched with the revenue from the first 100 t-shirts sold, while the cost of the 50 remaining t-shirts from the February purchase would be matched with the revenue from the remaining 50 t-shirts sold. The remaining 150 t-shirts from the February purchase would be considered as the ending inventory.
One of the main advantages of using the FIFO method is that it can result in a more accurate representation of the actual cost of goods sold during periods of increasing prices. As the oldest inventory is assigned to the cost of goods sold, the cost of inventory reflects the prices paid when the inventory was originally acquired. This method is particularly beneficial when inventory costs are rising, as it usually results in a lower cost of goods sold, higher gross profit, and higher ending inventory value.
However, it’s important to consider that using the FIFO method may not always reflect the physical flow of goods in certain industries. For example, in industries where products have a limited shelf life or are subject to obsolescence, the assumption that the first inventory items are sold first may not accurately represent the actual flow of goods. In such cases, other valuation methods like the LIFO or weighted average cost method may be more appropriate.
It’s essential for businesses to carefully evaluate their industry, inventory characteristics, and financial objectives to determine which inventory valuation method, including FIFO, is most suitable for their specific situation. This choice will affect the accuracy of financial statements, cost of goods sold, profitability, and tax liabilities. By employing the appropriate inventory valuation method, businesses can ensure they are accurately representing the value of their inventory on the balance sheet and making informed financial decisions.
Now that we’ve covered the FIFO method, let’s move on to exploring another commonly used inventory valuation method: the LIFO (Last-In, First-Out) method.
LIFO Method (Last-In, First-Out)
The LIFO method, which stands for Last-In, First-Out, is an inventory valuation method that assumes the most recently acquired or produced inventory items are the first ones sold. Under this method, the cost of the most recent inventory purchases is matched with the revenue from sales, while the cost of older inventory is assigned to the ending inventory. The logic behind the LIFO method is that the last inventory items purchased are usually the ones sold first, reflecting the most current costs.
Here’s an example to help illustrate how the LIFO method works:
Let’s consider a computer retailer that purchases 100 laptops at a cost of $800 each on January 1st and then purchases an additional 200 laptops at a cost of $900 each on February 1st. During the month of February, the retailer sells 150 laptops. With the LIFO method, the cost of the last 150 laptops purchased in February would be matched with the revenue from the laptops sold. The remaining 50 laptops from the January purchase would be considered as the ending inventory.
The LIFO method can have specific advantages for businesses, particularly when inventory costs are rising over time. By assigning the cost of the most recent inventory purchases to the cost of goods sold, the LIFO method results in a higher cost of goods sold and a lower ending inventory value. This can, in turn, have potential tax benefits for businesses by reducing their taxable income. Additionally, during periods of inflation, the LIFO method may provide a more accurate reflection of the replacement cost of inventory.
However, it’s important to note that the LIFO method may not always accurately represent the actual flow of goods, especially in industries where products have a limited shelf life or are subject to obsolescence. In such cases, other valuation methods like the FIFO or weighted average cost method may be more appropriate.
It’s crucial for businesses to carefully consider their industry, inventory characteristics, and financial objectives when deciding whether to use the LIFO method. This choice will impact the accuracy of financial statements, cost of goods sold, profitability, and tax liabilities. Keep in mind that the LIFO method may also require additional record-keeping to properly manage the flow of inventory and ensure accurate cost allocation.
Now that we’ve explored the LIFO method, let’s move on to discuss another commonly used inventory valuation method: the weighted average cost method.
Weighted Average Cost Method
The weighted average cost method is an inventory valuation method that calculates the average cost of all units available for sale during a given period and assigns this average cost to the units in ending inventory. This method takes into account both the cost of the beginning inventory and the cost of additional units purchased or produced during the period.
Here’s an illustration of how the weighted average cost method works:
Let’s say a furniture manufacturer has 100 chairs in the beginning inventory, which were purchased at a cost of $50 each. During the period, the manufacturer purchases an additional 200 chairs at a cost of $60 each. Under the weighted average cost method, the total cost of the chairs in the beginning inventory ($5,000) and the additional chairs purchased ($12,000) would be added together to get a total cost of $17,000. The weighted average cost per chair would be calculated as $17,000 divided by the total number of chairs (300), resulting in a weighted average cost of $56.67 per chair. This weighted average cost per chair would then be multiplied by the number of chairs in the ending inventory to determine its value on the balance sheet.
The weighted average cost method provides a more stable and consistent inventory valuation, as it smooths out fluctuations in inventory costs. It incorporates the costs of both older and newer inventory items, preventing significant variances in inventory value when there are large price fluctuations.
This method is particularly suitable when the cost of inventory fluctuates frequently or when inventory units are indistinguishable from each other. It provides a fair representation of the overall cost of inventory and can be a straightforward calculation when using appropriate inventory management systems.
It’s important to note that the weighted average cost method may have drawbacks in situations where prices are vola-ile or when inventory units have significant variations in costs. Additionally, using this method may require additional record-keeping to properly track and calculate the weighted average cost.
Choosing the appropriate inventory valuation method, including the weighted average cost method, is crucial for accurate financial reporting and decision-making. Businesses must consider their specific industry, inventory characteristics, and financial objectives when determining which method is most suitable for their situation.
Now that we have explored the weighted average cost method, let’s move on to discuss another inventory valuation method: the specific identification method.
Specific Identification Method
The specific identification method is an inventory valuation method that involves individually tracking the cost of each item in the inventory. Unlike other methods that use average costs or assumptions about the flow of goods, the specific identification method assigns the exact cost of each item to the corresponding revenue.
This method is particularly applicable in industries where inventory items are unique, high-value, or have distinct serial numbers or features. Examples include artwork, jewelry, custom-built products, or large machinery. In such cases, the specific identification method provides the most accurate representation of the inventory’s value on the balance sheet.
Here’s an example to illustrate how the specific identification method works:
Let’s consider a car dealership that has five cars in its inventory. Each car has a unique cost and serial number. The dealership sells three cars during the accounting period. Under the specific identification method, the cost of each individual car sold would be matched with the corresponding revenue from the car’s sale. The remaining two cars would be carried in the ending inventory at their individual costs.
The specific identification method provides precise information about the value of inventory, particularly for businesses dealing with items that have distinct characteristics and varying costs. It allows for an accurate representation of inventory value based on the actual costs incurred for each unit.
However, it’s important to note that the specific identification method may not be practical for businesses dealing with large quantities of homogenous goods or items that are not easily traceable. Tracking the cost of each individual unit can be cumbersome and may require additional administrative efforts and record-keeping.
The specific identification method is typically used in combination with other valuation methods for specialized items within the overall inventory. By utilizing this method for high-value or unique items and using other valuation methods for the remaining inventory, businesses can strike a balance between accuracy and practicality.
When selecting the appropriate inventory valuation method, businesses must carefully consider the nature of their inventory, industry requirements, and financial objectives. The choice made will impact the accuracy of financial statements, cost of goods sold, profitability, and tax liabilities.
Now that we have explored the specific identification method, let’s move on to the step-by-step process of calculating inventory on the balance sheet.
Calculating Inventory on Balance Sheet
Calculating inventory on the balance sheet involves determining the cost of goods sold (COGS) and the value of inventory at the end of a specified accounting period. This information is essential for accurately reporting a company’s financial position and evaluating its profitability.
Here are the key steps to calculate inventory on the balance sheet:
Step 1: Determine the Cost of Goods Sold (COGS)
The COGS represents the cost incurred to produce or purchase the goods that have been sold during the accounting period. It can be calculated using the following formula:
COGS = Beginning Inventory + Purchases – Ending Inventory
The beginning inventory is the value of inventory at the start of the accounting period, while purchases refer to the cost of additional inventory acquired during the period. The ending inventory represents the value of inventory that remains unsold at the end of the period.
Step 2: Calculate the Ending Inventory
The ending inventory is the value of inventory that is still on hand at the end of the accounting period. It can be determined using one of the inventory valuation methods discussed earlier, such as FIFO, LIFO, weighted average cost, or specific identification. The chosen method will determine how the cost of goods sold is allocated and the remaining value of the inventory.
Step 3: Calculate the Inventory Turnover Ratio
The inventory turnover ratio measures how efficiently a company manages its inventory by evaluating the number of times the inventory is sold and replaced within a given period. It can be calculated using the following formula:
Inventory Turnover Ratio = COGS / Average Inventory
The average inventory is obtained by adding the beginning and ending inventory for the period and dividing by two. A higher inventory turnover ratio indicates a more efficient utilization of inventory.
Step 4: Calculate the Days Inventory Outstanding (DIO)
The DIO represents the average number of days it takes for a company to sell its entire inventory. It is calculated using the following formula:
DIO = 365 / Inventory Turnover Ratio
The lower the DIO, the faster a company is turning its inventory into sales, which is generally preferred.
By following these steps, businesses can accurately determine the value of their inventory on the balance sheet, assess their inventory management efficiency, and make informed decisions regarding purchasing, production, and sales strategies.
Analyzing inventory on the balance sheet provides valuable insights into a company’s ability to manage its inventory effectively and maintain optimal stock levels. Having accurate and up-to-date inventory information is crucial for financial reporting and decision-making processes.
In the next section, we will explore the significance and benefits of accurate inventory calculation.
Step 1: Determine the Cost of Goods Sold (COGS)
In order to calculate inventory on the balance sheet, one of the crucial steps is determining the cost of goods sold (COGS). The COGS represents the cost incurred to produce or purchase the goods that have been sold during a specific accounting period. This figure is essential for accurately assessing a company’s profitability and financial performance.
To calculate the COGS, the following formula can be used:
COGS = Beginning Inventory + Purchases – Ending Inventory
The beginning inventory refers to the value of the inventory at the start of the accounting period. It represents the cost of goods that were not sold and were carried over from the previous period. The purchases encompass the additional inventory acquired during the accounting period, whether through production or purchases from suppliers. Lastly, the ending inventory represents the value of goods that remain unsold at the end of the period.
By subtracting the value of the ending inventory from the sum of the beginning inventory and purchases, businesses can determine the cost of goods that have been sold during the period.
It’s important to note that the values used in the COGS calculation should align with the chosen inventory valuation method. The specific method employed, such as FIFO, LIFO, or weighted average cost, will dictate how the cost of goods sold is allocated and reported.
Accurate determination of COGS is vital for several reasons. Firstly, it directly impacts a company’s gross profit, which is calculated by subtracting the COGS from the revenue. Gross profit provides insight into a company’s ability to generate revenue and effectively manage its production and inventory costs.
Furthermore, COGS is a key component in assessing a company’s profitability margins and financial ratios. It is used in the calculation of metrics such as the gross profit margin, which measures the percentage of revenue retained after accounting for the production costs.
Additionally, the COGS figure is necessary for calculating the inventory turnover ratio—a metric that assesses how efficiently a company manages its inventory. This ratio compares the COGS to the average value of the inventory over a specific period, providing insights into inventory utilization and turnover speed.
By accurately determining the COGS, businesses can gain a comprehensive understanding of their production costs, profitability, and inventory management practices. This information is essential for making informed financial decisions, evaluating performance, and ensuring effective inventory control.
Now that we’ve covered the first step of determining the COGS, let’s move on to the next step of calculating inventory on the balance sheet.
Step 2: Calculate the Ending Inventory
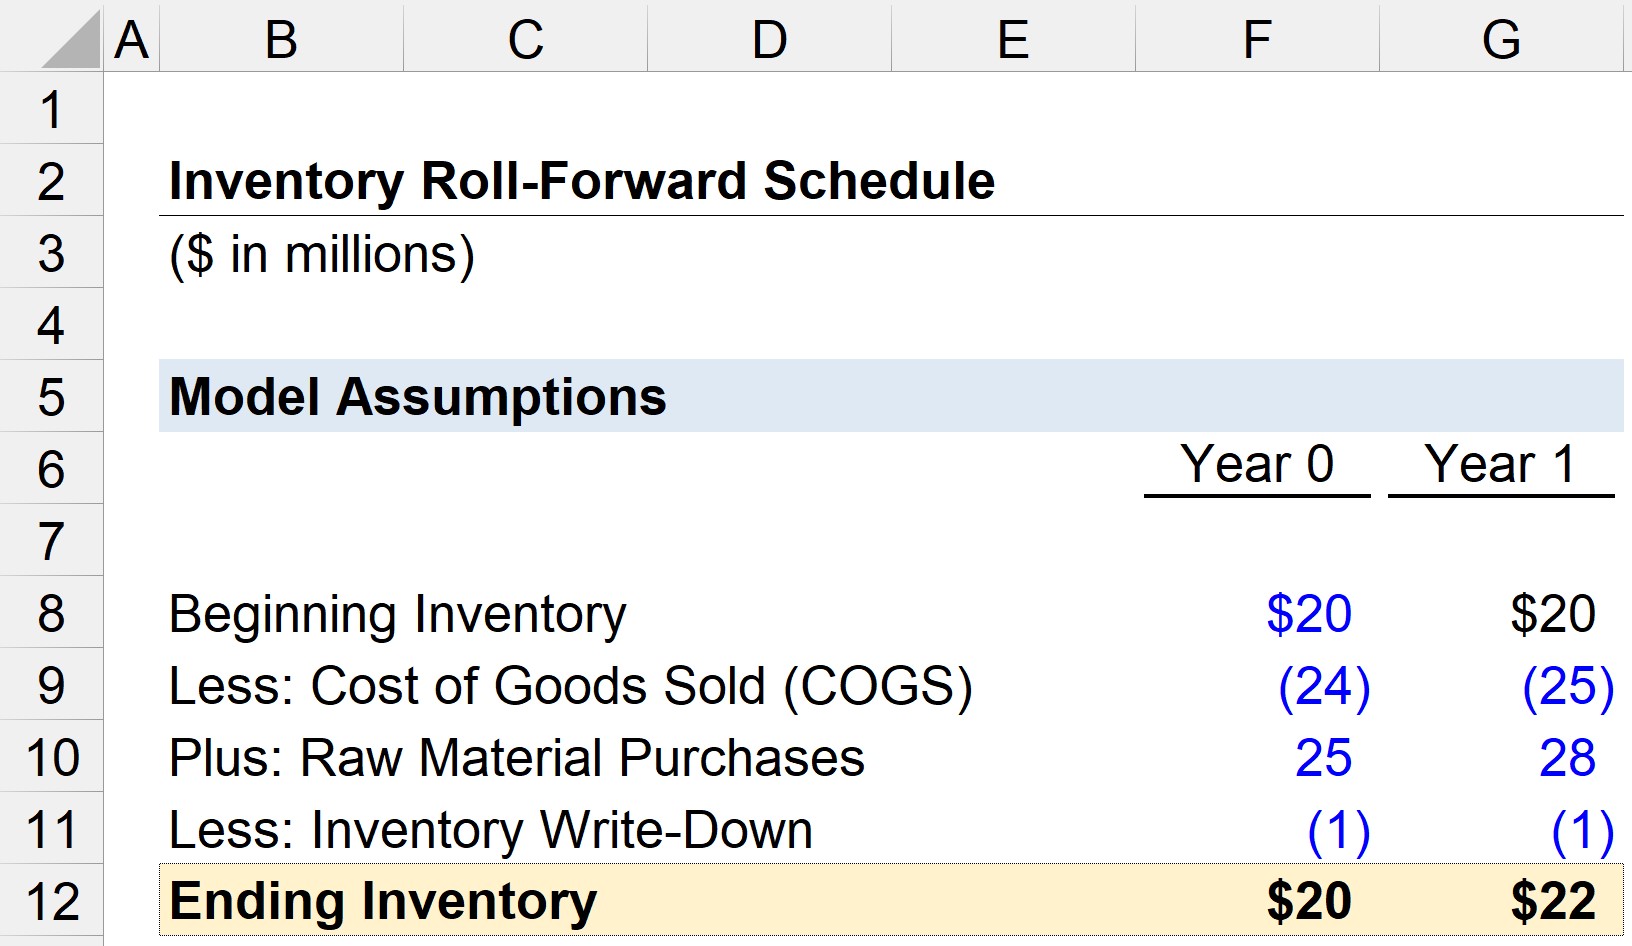
After determining the cost of goods sold (COGS) in the previous step, the next important component in calculating inventory on the balance sheet is determining the value of the ending inventory. The ending inventory represents the value of goods that remain unsold at the end of the accounting period and is crucial for accurately assessing a company’s financial position.
The value of the ending inventory can be calculated using various inventory valuation methods, such as FIFO (First-In, First-Out), LIFO (Last-In, First-Out), weighted average cost, or specific identification. The chosen method will impact the allocation of costs and the resulting value attributed to the ending inventory.
In the FIFO method, the cost of the earliest goods purchased or produced is assigned to the units remaining in the ending inventory, while the cost of the most recent goods is assigned to the cost of goods sold. This method assumes that the oldest inventory is sold first.
The LIFO method, on the other hand, assigns the cost of the most recent goods purchased or produced to the units sold, with the cost of the oldest goods assigned to the ending inventory. LIFO assumes that the most recent inventory is sold first.
The weighted average cost method calculates the average cost per unit by dividing the total cost of goods available for sale by the total number of units. This average cost per unit is then used to determine the value of the ending inventory by multiplying it by the number of units remaining.
The specific identification method tracks and assigns the actual cost of each individual item in the inventory. This method is typically used for high-value or unique items where it is feasible to identify and assign specific costs to each item.
By applying the appropriate inventory valuation method, businesses can determine the value of the ending inventory at the end of the accounting period. This value is crucial for accurately reporting the assets and financial position of a company.
Accurately calculating the value of the ending inventory is essential for several reasons. Firstly, it allows businesses to determine their total inventory value, which is reported as a current asset on the balance sheet.
The ending inventory value is also used in the calculation of various financial ratios and metrics, such as the current ratio and inventory turnover ratio. These ratios provide insights into a company’s liquidity, efficiency in managing inventory, and profitability.
Additionally, the ending inventory value plays a significant role in the accurate determination of the cost of goods sold (COGS) in the income statement. The COGS is subtracted from the revenue to calculate gross profit, which reflects the profitability of a company’s core operations.
In summary, accurately calculating the value of the ending inventory is crucial for properly assessing a company’s financial position, profitability, and efficiency in managing inventory. It helps businesses make informed decisions regarding production, purchasing, and sales strategies to ensure optimal inventory control and effective financial management.
Now that we’ve covered the second step of calculating inventory on the balance sheet, let’s move on to the next step: calculating the inventory turnover ratio.
Step 3: Calculate the Inventory Turnover Ratio
Calculating the inventory turnover ratio is an important step in assessing how efficiently a company manages its inventory. The inventory turnover ratio measures the number of times a company sells and replaces its inventory within a given accounting period. This ratio provides valuable insights into inventory utilization and turnover speed.
The inventory turnover ratio is calculated using the following formula:
Inventory Turnover Ratio = Cost of Goods Sold (COGS) / Average Inventory
The COGS represents the cost incurred to produce or purchase the goods that have been sold during the accounting period. It can be obtained from the income statement or calculated using the formula discussed in “Step 1: Determine the Cost of Goods Sold (COGS)”.
The average inventory is calculated by adding the value of the beginning inventory and the value of the ending inventory and dividing it by two. This average inventory value represents the average level of inventory across the accounting period.
The resulting inventory turnover ratio indicates how many times the average inventory is sold and replaced over the course of the accounting period. A higher inventory turnover ratio indicates a more efficient utilization of inventory, as it demonstrates that a company is selling its products at a faster rate and replenishing its inventory more frequently.
Conversely, a lower inventory turnover ratio suggests that a company may be holding excessive levels of inventory, potentially tying up capital and incurring additional costs for storage, holding, and potential obsolescence.
It’s important to note that the interpretation of the inventory turnover ratio may differ across industries. Some industries, such as fast-moving consumer goods, may have higher turnover ratios due to their perishable nature and frequent sales cycles. Other industries, such as luxury goods or specialized equipment, may have lower turnover ratios due to the longer sales cycles and higher prices of their products.
By calculating and analyzing the inventory turnover ratio, businesses can gain insights into their inventory management practices, identify potential inefficiencies, and make informed decisions about purchasing, production, and sales strategies. It also allows companies to benchmark their performance against industry standards and competitors.
Now that we’ve covered the third step of calculating inventory on the balance sheet, let’s move on to the final step: calculating the days inventory outstanding (DIO).
Step 4: Calculate the Days Inventory Outstanding (DIO)
Calculating the Days Inventory Outstanding (DIO) is a crucial step in evaluating the efficiency of inventory management and understanding how long it takes for a company to sell its entire inventory. The DIO represents the average number of days it takes for a company to convert its inventory into sales.
The DIO can be calculated using the following formula:
Days Inventory Outstanding (DIO) = 365 / Inventory Turnover Ratio
The inventory turnover ratio measures how many times a company sells and replenishes its inventory within an accounting period. It can be obtained from the calculation discussed in “Step 3: Calculate the Inventory Turnover Ratio”.
The DIO ratio provides insights into the efficiency of inventory management. A lower DIO indicates that a company is turning its inventory into sales at a faster rate, suggesting efficient inventory control and a quicker conversion of inventory investment into revenue.
Conversely, a higher DIO implies that it takes a longer time for a company to sell its inventory. This may be an indication of inefficiencies in inventory management, such as overstocking, slow-moving items, or issues with demand forecasting.
The DIO ratio can be used for benchmarking purposes, comparing a company’s performance against industry averages, competitors, or historical data. It can also be used to assess the effectiveness of inventory management strategies over time.
It’s important to note that the interpretation of the DIO ratio may vary across industries. Some industries naturally operate with higher DIO ratios due to the nature of their products, longer production cycles, or specific market dynamics. Comparing DIO ratios within the same industry provides more meaningful insights into individual company performance.
By calculating and monitoring the DIO ratio, companies can identify areas of improvement, optimize inventory levels, minimize carrying costs, and increase overall operational efficiency. It helps facilitate better inventory management decisions and aids in aligning inventory practices with market demands and customer preferences.
Now that we’ve covered the final step of calculating inventory on the balance sheet, let’s move on to the next section: analyzing inventory on the balance sheet.
Analyzing Inventory on Balance Sheets
Analyzing inventory on balance sheets provides valuable insights into a company’s inventory management practices and financial health. By examining the inventory figures, businesses can evaluate their inventory turnover, liquidity, profitability, and overall operational efficiency.
Here are some key factors to consider when analyzing inventory on balance sheets:
Inventory Turnover:
The inventory turnover ratio, calculated in “Step 3: Calculate the Inventory Turnover Ratio,” indicates how efficiently a company utilizes its inventory. A high turnover ratio suggests effective inventory management and a quick conversion of inventory into sales. On the other hand, a low turnover ratio may indicate issues such as overstocking or slow-moving inventory that ties up capital and affects profitability.
Days Inventory Outstanding (DIO):
The Days Inventory Outstanding (DIO) ratio, calculated in “Step 4: Calculate the Days Inventory Outstanding (DIO),” provides an average number of days it takes for a company to sell its inventory. Monitoring this ratio helps identify potential inefficiencies, such as excess inventory levels, slow sales, or inadequate demand forecasting.
Inventory Valuation Methods:
The inventory valuation method chosen by a company (e.g., FIFO, LIFO, weighted average cost, or specific identification) affects the value reported on the balance sheet. Evaluating the impact of the chosen method and considering the industry norms and financial goals is crucial for understanding the accuracy of inventory figures.
Inventory Levels and Trends:
Examining the changes in inventory levels over time helps identify patterns and trends in inventory management. A consistent increase in inventory may signify sales growth or ineffective inventory control. Conversely, declining inventory levels may indicate increased efficiency but could also be a result of understocking.
Obsolete or Outdated Inventory:
Determining the presence of obsolete or outdated inventory is crucial for accurately assessing the value of inventory on the balance sheet. Such inventory can lead to financial losses and may require write-offs or liquidation strategies to mitigate their impact on company finances.
Comparative Analysis:
Conducting a comparative analysis of inventory figures against industry benchmarks or competitors’ performance provides valuable insights. Understanding how a company’s inventory turnover, DIO ratio, and inventory levels compare to others in the industry helps identify areas for improvement and potential competitive advantages.
By analyzing inventory on balance sheets, businesses can identify opportunities for optimizing inventory management, reducing carrying costs, improving sales forecasting, and enhancing overall financial performance. This information also aids in making informed decisions regarding pricing, production, and supply chain strategies, ensuring proper alignment with market demands and maximizing profitability.
Now that we’ve covered the analysis of inventory on the balance sheet, let’s move on to discussing the benefits of accurate inventory calculation.
Benefits of Accurate Inventory Calculation
Accurate inventory calculation is essential for businesses in numerous ways. It provides several key benefits that positively impact financial management, operational efficiency, and decision-making processes. Here are some significant advantages of accurate inventory calculation:
1. Financial Reporting Accuracy:
Accurate inventory calculation ensures that a company’s financial statements reflect the true value of inventory on hand. This accuracy is vital for compliance with accounting standards, as well as providing transparency to shareholders, investors, and other stakeholders. It contributes to the overall reliability and trustworthiness of financial reporting.
2. Profitability Assessment:
Accurate inventory calculation allows businesses to determine the cost of goods sold (COGS) and accurately assess their profitability. By precisely matching revenue with the corresponding inventory costs, businesses can calculate gross profit and net profit figures that reflect the true performance of their core operations. This helps in identifying whether a company is pricing its products correctly and generating sufficient profit margins.
3. Efficient Resource Allocation:
Accurate inventory calculation enables businesses to make informed decisions regarding resource allocation. It helps determine optimal stock levels, avoiding overstocking that ties up capital or understocking that leads to lost sales opportunities. By aligning inventory levels with customer demand, businesses can reduce carrying costs, increase inventory turnover, and ensure more efficient use of their resources.
4. Effective Production Planning:
Accurate inventory calculation provides insights into inventory levels, allowing businesses to plan their production activities efficiently. By understanding the quantity and timing of inventory needs, businesses can optimize procurement, production schedules, and supply chain management. This leads to reduced wastage, improved operational efficiency, and smoother production processes.
5. Improved Cash Flow Management:
Accurate inventory calculation helps businesses manage their cash flow more effectively. By aligning inventory levels with customer demand, businesses can reduce the amount of working capital tied up in excess inventory. This allows for better allocation of funds to other operational needs, investment opportunities, or debt repayment, ultimately improving overall financial stability and liquidity.
6. Enhanced Customer Satisfaction:
Accurate inventory calculation enables businesses to meet customer demands more effectively. By having the right products available at the right time, businesses can avoid stockouts and ensure timely order fulfillment. This enhances customer satisfaction, strengthens brand reputation, and potentially leads to repeat business and customer loyalty.
Overall, accurate inventory calculation is crucial for businesses to maintain financial health, operational efficiency, and customer satisfaction. It ensures reliable financial reporting, facilitates informed decision-making, and results in improved resource allocation, production planning, and cash flow management. By prioritizing accurate inventory calculation, businesses can gain a competitive edge in their industry and drive sustainable growth.
Now that we’ve discussed the benefits of accurate inventory calculation, let’s conclude the article.
Conclusion
Accurate inventory calculation is a fundamental aspect of financial management and operations for businesses in all industries. Understanding how to calculate inventory on balance sheets allows companies to assess their financial performance, make informed decisions, and ensure efficient inventory management.
Throughout this comprehensive guide, we have explored the various types of inventory, including raw materials, work-in-progress, and finished goods. We have also delved into different inventory valuation methods, such as FIFO, LIFO, weighted average cost, and specific identification, to determine the value of inventory on the balance sheet.
The step-by-step process of calculating inventory on the balance sheet, including determining the cost of goods sold (COGS), calculating the ending inventory, and assessing the inventory turnover ratio and days inventory outstanding (DIO), provides businesses with valuable insights into their inventory management efficiency.
Accurate inventory calculation offers numerous benefits for businesses. It ensures financial reporting accuracy, allows for accurate profitability assessment, facilitates efficient resource allocation, aids in effective production planning, improves cash flow management, and enhances customer satisfaction.
By accurately calculating inventory and analyzing inventory figures on balance sheets, businesses can optimize their financial performance, reduce costs, minimize inventory holding, and make informed decisions about pricing, production, and sales strategies.
Ultimately, accurate inventory calculation lays the foundation for effective financial management, streamlined operations, and improved profitability. It enables businesses to maintain a strong competitive position in the market, enhance customer relationships, and drive sustainable growth.
Now armed with a deeper understanding of how to calculate inventory on balance sheets, businesses can confidently navigate the complexities of inventory management and make strategic decisions to create long-term success.
